


Supply Chain Visibility Software: Real-Time Freight Tracking & Control Tower
Track truck, rail, barge, and intermodal freight in one system, and proactively address delays before they reach your dock.
Stay ahead of freight, from tender to delivery


Every truckload, railcar, and barge in one view
See carrier locations, rail sightings, and barge updates in a single system.
- Truck: loads report live location and milestone status from pickup to delivery, so a check call becomes the exception, not your daily routine
- Rail and barge: railcars have a live position, Rail ASN notices arrive days ahead of the railroad, and barge movements appear alongside truck
- Intermodal: Princeton TMX tracks and automates transfers between carriers and modes, so a handoff doesn’t become a blind spot

Plan around when freight will actually arrive
Give plant planners and customers an arrival time they can count on.
- Live in-transit data refines each arrival prediction, so a slow truck or a late railcar shows up the moment it slips
- Planned transit times are based on truck-legal routing and commercial mileage, not point-to-point guesses
- Plant teams and customers see the revised ETA without anyone chasing a status, and receiving sites can adjust dock schedules to match

Catch late loads while you can still act
See delays, stalled shipments, and route deviations as they happen
- Issues are flagged automatically across every mode, tracking outages included, and predictive analytics surface disruption risk
- Alerts land in a work queue with an owner; rail queues show last sighting, carrier, dwell hours, and destination ETA
- Root-cause data shows whether the problem traces to origin delays, carrier performance, or a lane, and exception management carries recovery to resolution

Give the team running freight the full picture
Network-wide dashboards and trend reporting replace data stitched together from separate systems.
- Performance across every site and mode is measured against your KPIs in real time
- Truck, rail, barge, and intermodal are reported side by side, so mode-level comparisons need no extra data work
- Trend reporting across lane and spend performance, carriers, and origins surfaces repeat offenders before the next quarterly review


What is Supply Chain Visibility Software?
Supply chain visibility software tracks shipments in real time across every mode and flags problems before they reach your dock. Control tower analytics add a network-wide view: dashboards, exception ownership, and trend reporting across lanes, carriers, and plants.
Princeton TMX brings tracking from truck, rail, barge, and intermodal into the same shipment record you tender, schedule, and audit freight on, so one team works from one picture.
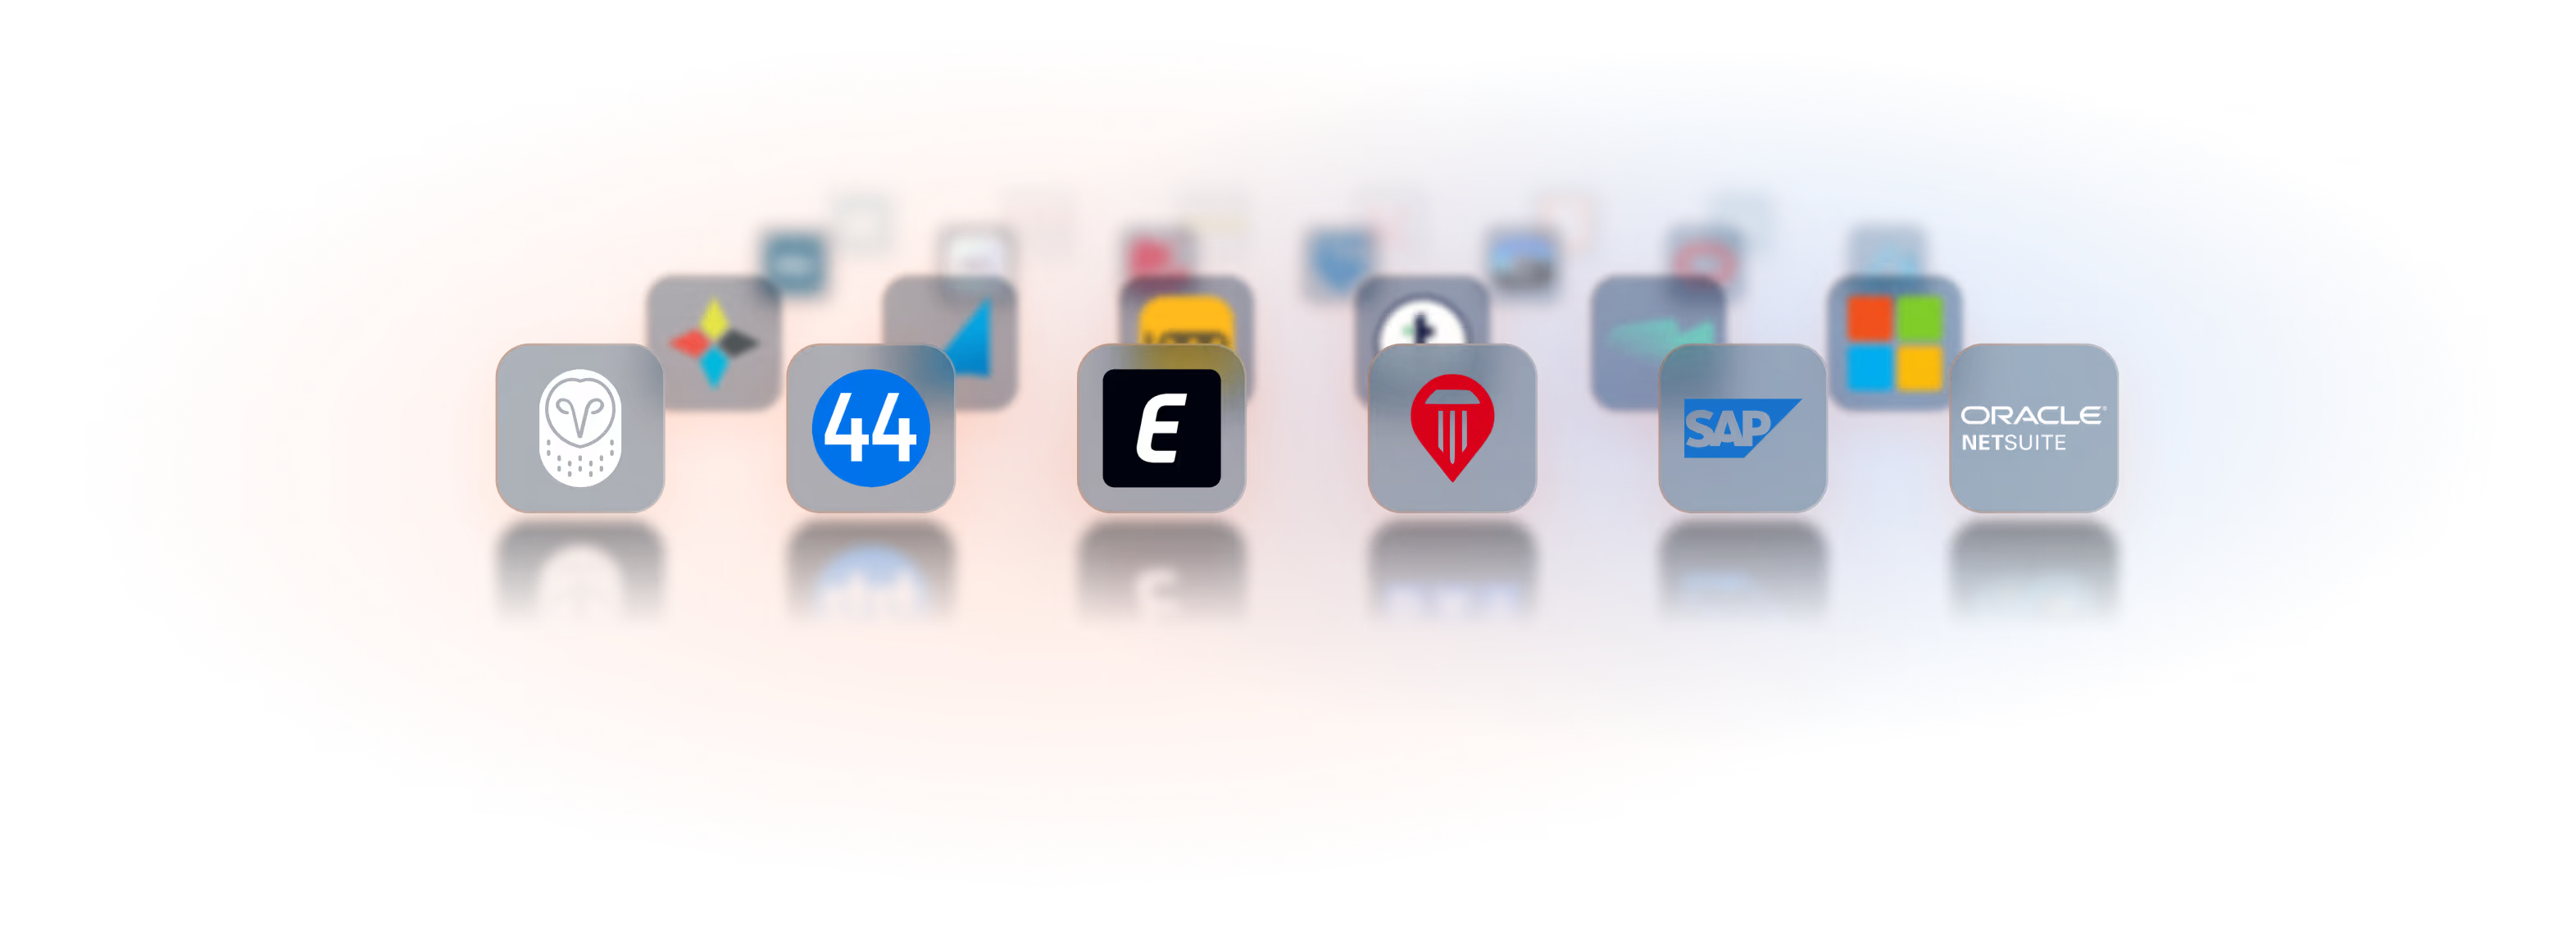
One platform for all your tech

Unify Workflows
All modules, datapoints, and teams work together to eliminate silos and minimize disruptions.

Real-Time Data
Every shipment update flows instantly across teams, carriers, and partners.

End-to-End Visibility
From planning to analytics, the entire shipment lifecycle stays connected.

Scale Operations
Configurable infrastructure allows you to operate across teams, locations, and modes without adding complexity.
Trusted by leading shippers
"Load tendering, which previously involved manual emails and data entry, now operates with minimal human intervention"

"They're helping make our supply chain more strategic and data-driven. We have folks across our business asking to see the data that our TMS is showing us—it's that valuable across our entire organization."


"Today, we have clear, real-time control over deliveries because of Princeton TMX."
Real shippers. Real results.
Learn how industry leading shippers are reducing costs, improving visibility, and gaining control of their freight with Princeton TMX's Unified Transportation Management System


Discover more solutions from Princeton TMX
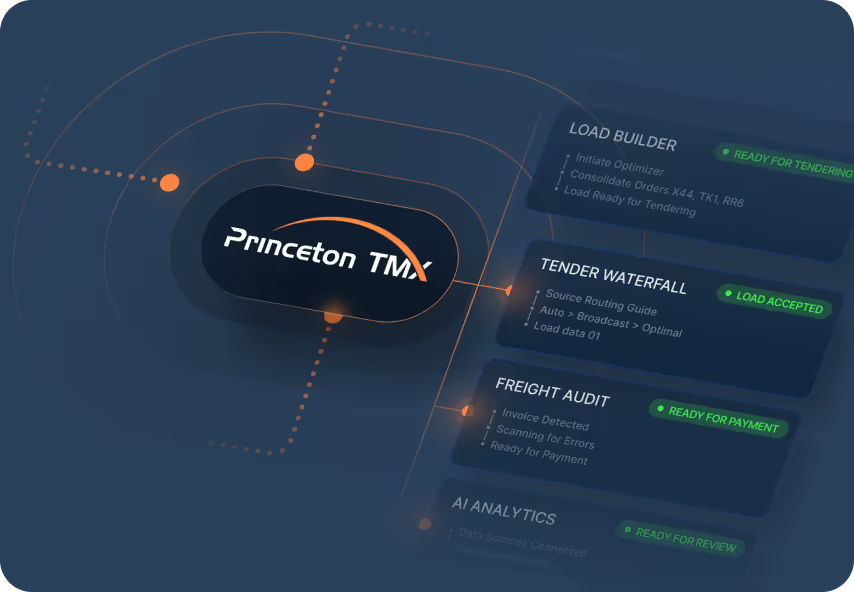
Workflow Automation
Eliminate manual workload and errors with AI and automation that streamline every part of your transportation management process.
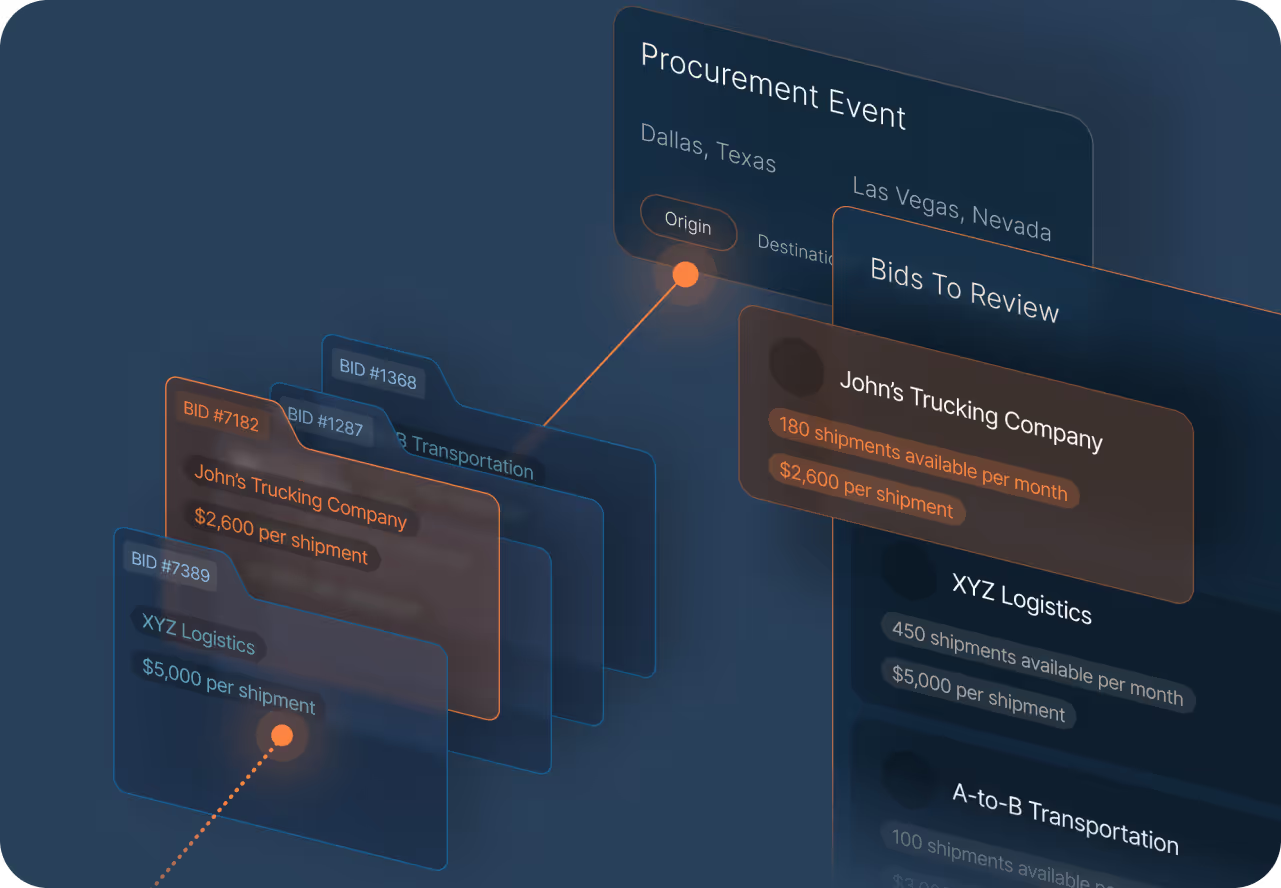
Procurement Events
Secure the best rates and service across every lane by centralizing data, automating communication, and empowering teams with AI-enabled insights.
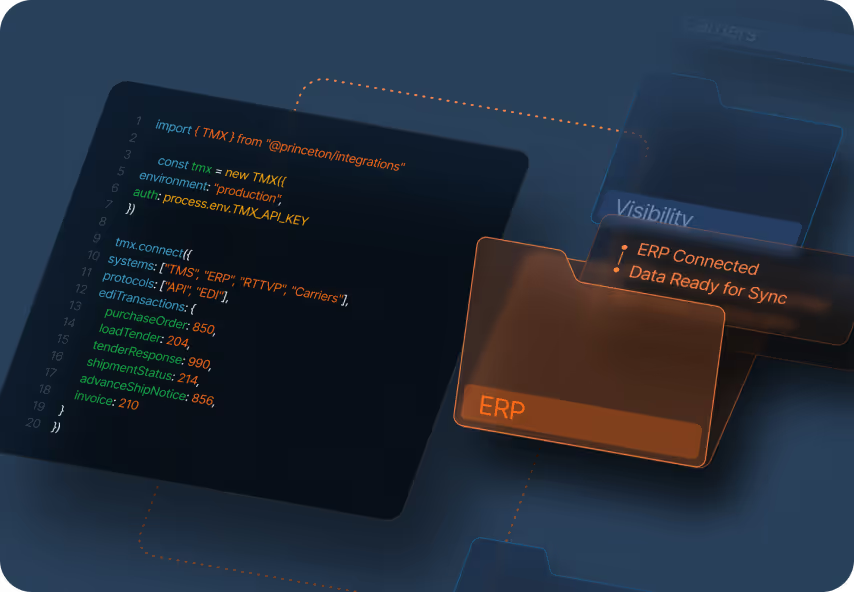
System Integrations
Easily integrate with enterprise resource planning, visibility, procurement, benchmarking, carrier systems, and more, enabling a single source of execution for your transportation teams.
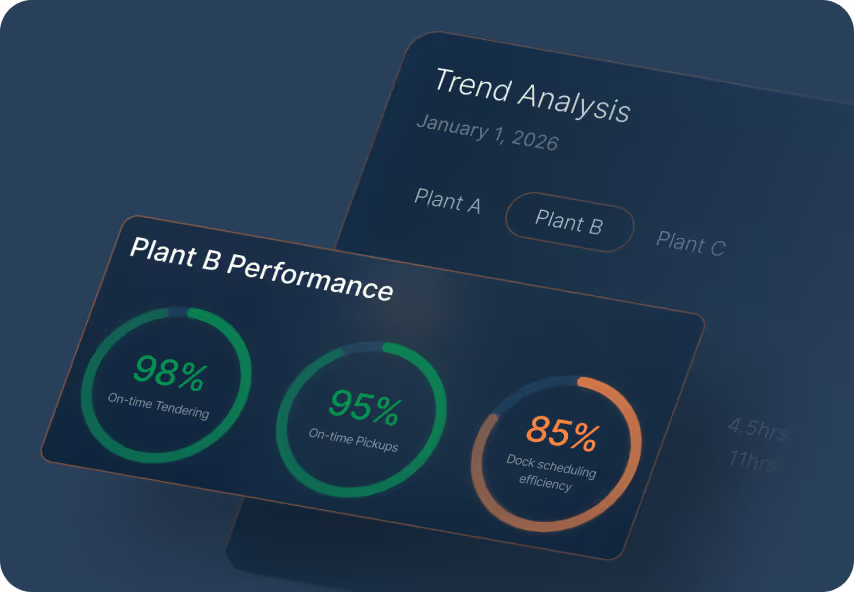
Origin & Plant Performance
Gain clear, data-driven visibility into how each origin, plant, and location operates, helping you optimize origin behavior for both cost and service improvements.
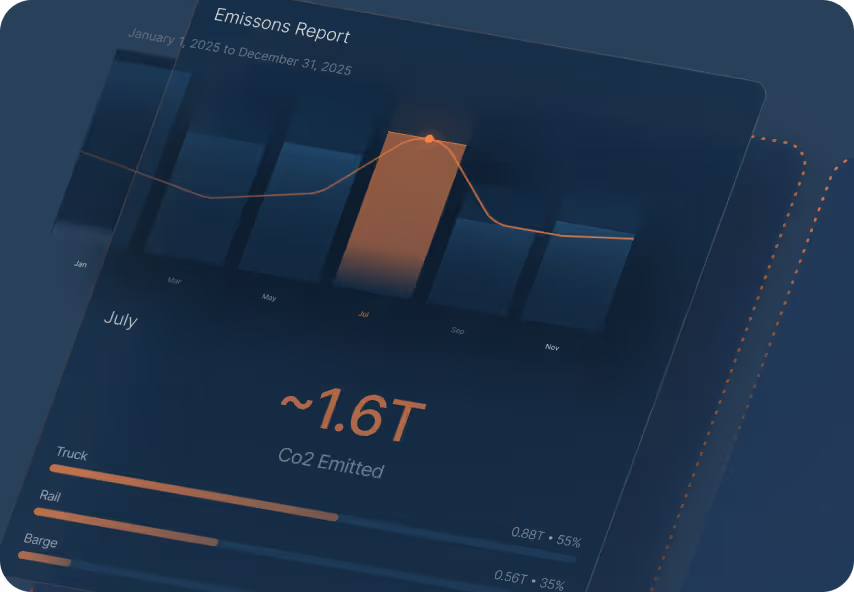
Sustainability Reporting
Meet increasingly complex regulatory and customer expectations by surfacing audit-ready sustainability insights.
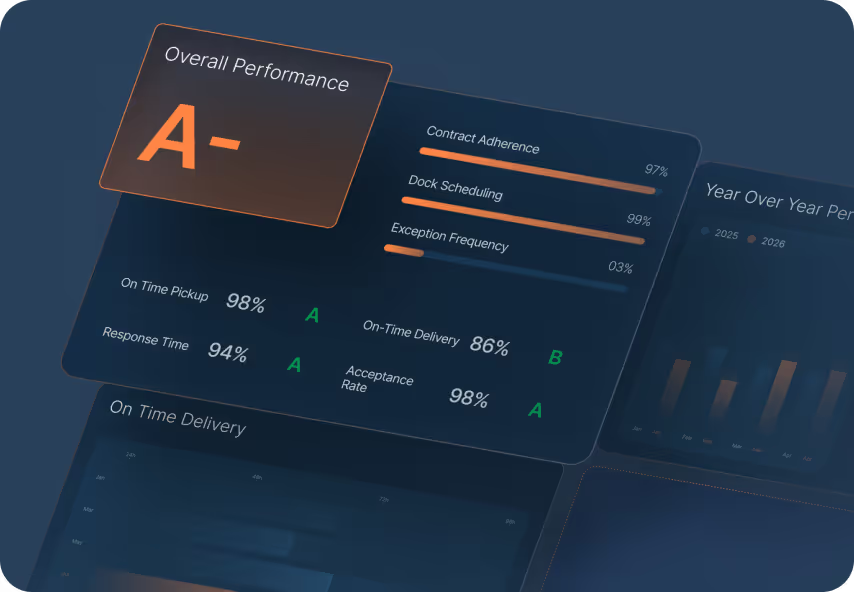
Carrier Performance
Unlock objective, real-time insights into how every carrier performs across cost, service, capacity, and compliance, empowering stronger partnerships and higher reliability.
Supply Chain Visibility
Track truck, rail, barge, and intermodal freight in one system, and proactively address delays before they reach your dock.
Supply Chain Visibility Software FAQs
Supply chain visibility software tracks shipments across truck, rail, barge, and intermodal and alerts you when a load is delayed. Princeton TMX attaches that tracking to the shipment record used for tendering, dock scheduling, and audit.
Visibility tells you where each shipment is and when it should arrive. A control tower uses that data to monitor the whole network at once: dashboards across modes and sites, exceptions assigned to owners, and trends across lanes, carriers, and plants. Princeton TMX gives transportation and supply chain teams both views in one platform.
Princeton TMX tracks all three in one platform: live truck location, car-level rail position with Rail ASN notice, and barge movements through OpenTug. Inbound rail is often the least visible freight, which is the inbound freight visibility gap Rail ASN closes.
Alerts need tracking data from every mode feeding one system. Princeton TMX flags delays, stalled shipments, route deviations, and tracking outages automatically and assigns each to an owner, with root-cause data attached.
No. A TMS plans and executes freight; visibility software tracks it in transit. Many visibility platforms run as a separate layer that has to be kept in sync with the TMS. Princeton TMX attaches tracking to the shipment record you execute on.