

Empower your people with AI and automation
Eliminate manual workload and errors with AI and automation that streamline every part of your transportation management process
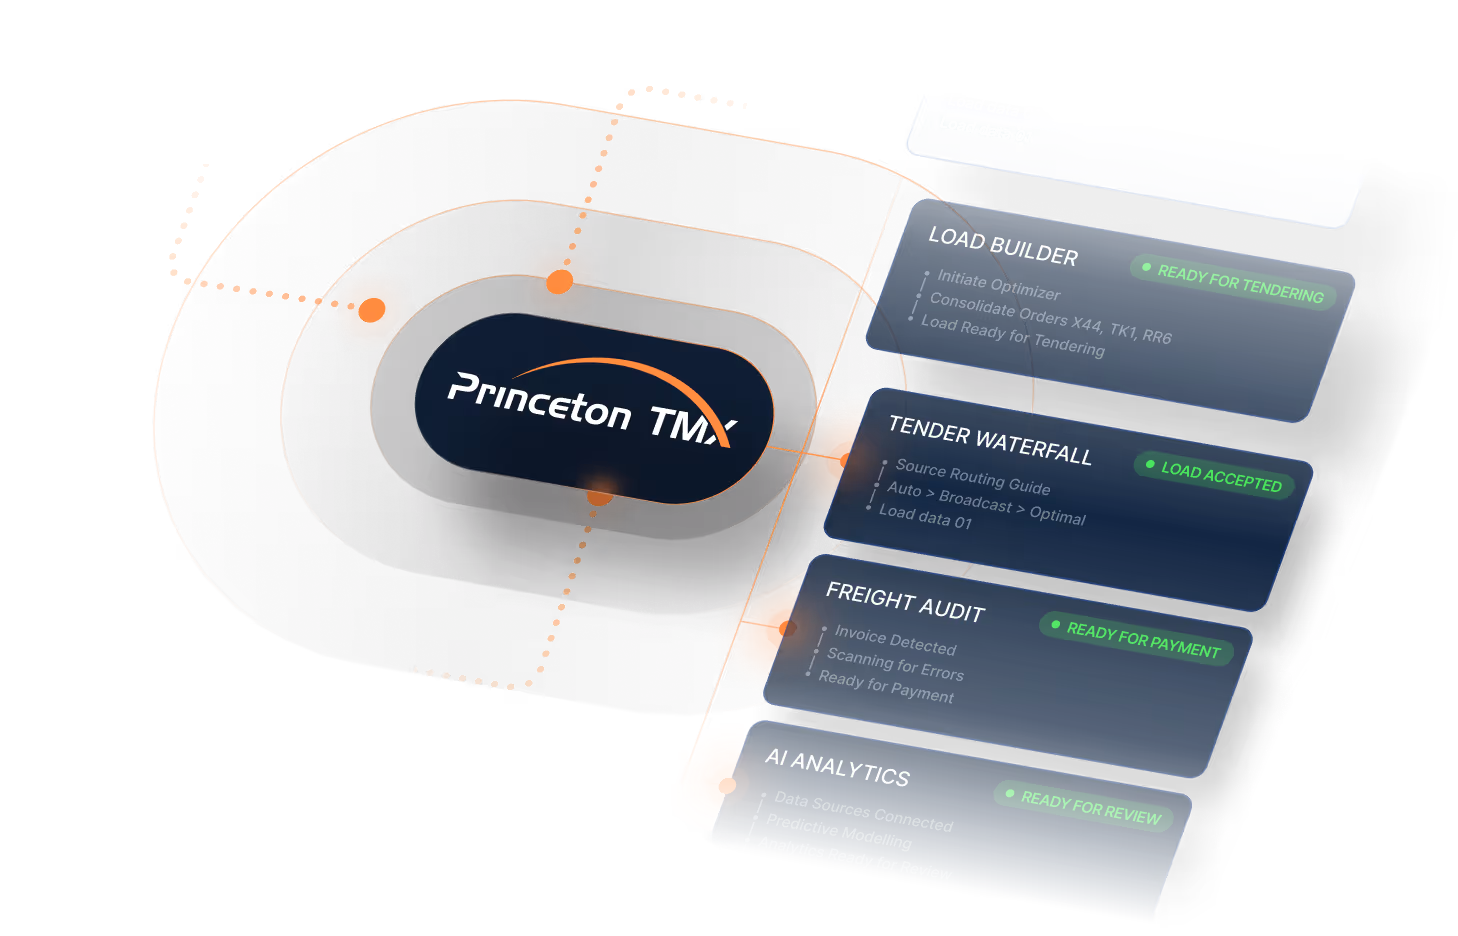
Run your network on autopilot


Build every load automatically
Princeton TMX syncs with your ERP to manage your outbound orders and automatically build loads that are ready to be tendered
- Auto-trigger load creation based on your business logic — ensure loads are generated at the right time using rules tailored to your network
- Combine orders intelligently by delivery date and destination — maximize utilization and reduce freight costs with automated consolidation
- Seamlessly integrate with carrier systems — streamline downstream workflows with loads formatted exactly as carriers require

Automate booking with top carriers
Princeton TMX automates carrier selection to find you the lowest cost and highest service carrier for every shipment
- Optimize every award with real-time data — instantly evaluate rates, capacity, and performance to choose the best carrier in seconds
- Eliminate manual outreach — automate tendering workflows and confirmations to reduce sending emails and chasing responses
- Improve service and reduce costs — ensure consistent carrier compliance while capturing meaningful savings across your network

Keep an eye on every shipment
Automated updates help you track every shipment across every mode, bringing predictability to your operations
- Gain end-to-end visibility — track shipments from pickup to delivery with live status updates and exception alerts
- Proactively manage disruptions — get notified of delays or route changes so your team can act before service is impacted
- Reduce customer inquiries — share accurate ETAs and shipment milestones with your customers automatically

Unify every data point
Consolidate data points from any location, mode, carrier, or shipment for a complete view of your network operations
- Centralize your network insights — bring together rate, tender, tracking, and cost data into a single source of truth
- Identify savings and performance trends — surface patterns in spend, carrier reliability, lane efficiency, and more
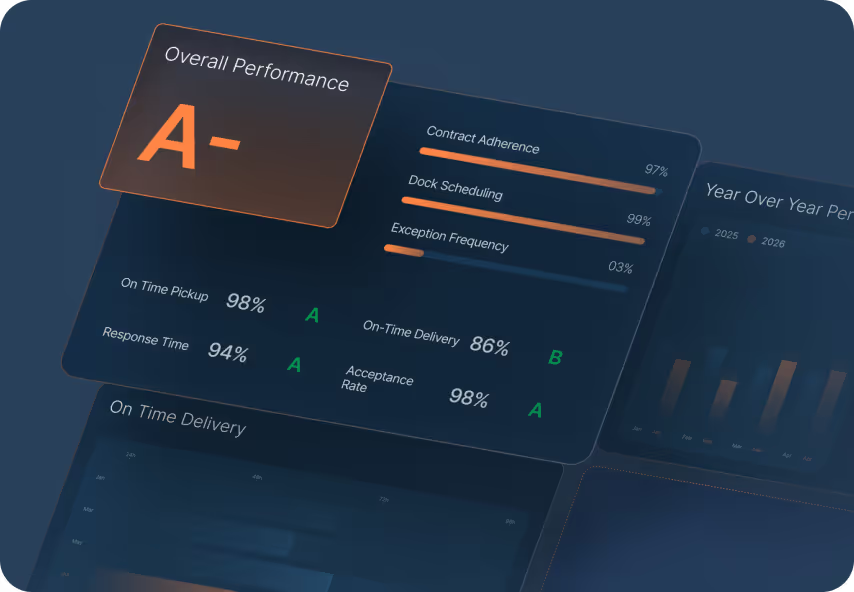
- Power better decisions with actionable intelligence — transform raw data into dashboards, KPIs, and reports that drive continuous improvement


One platform for all your tech


Unify Workflows
All modules, data points, and teams work together to eliminate silos and minimize disruptions

Real-Time Data
Every shipment update flows instantly across teams, carriers, and partners

End-to-End Visibility
From planning to analytics, the entire shipment lifecycle stays connected

Scale Operations
Configurable infrastructure allows you to operate across teams, locations, and modes without adding complexity
Trusted by leading shippers

"Load tendering, which previously involved manual emails and data entry, now operates with minimal human intervention"

"They're helping make our supply chain more strategic and data-driven. We have folks across our business asking to see the data that our TMS is showing us—it's that valuable across our entire organization."

"Today, we have clear, real-time control over deliveries because of Princeton TMX."
Real shippers. Real results.
Learn how industry leading shippers are reducing costs, improving visibility, and gaining control of their freight with Princeton TMX's Unified Transportation Management System
Discover more solutions from Princeton TMX
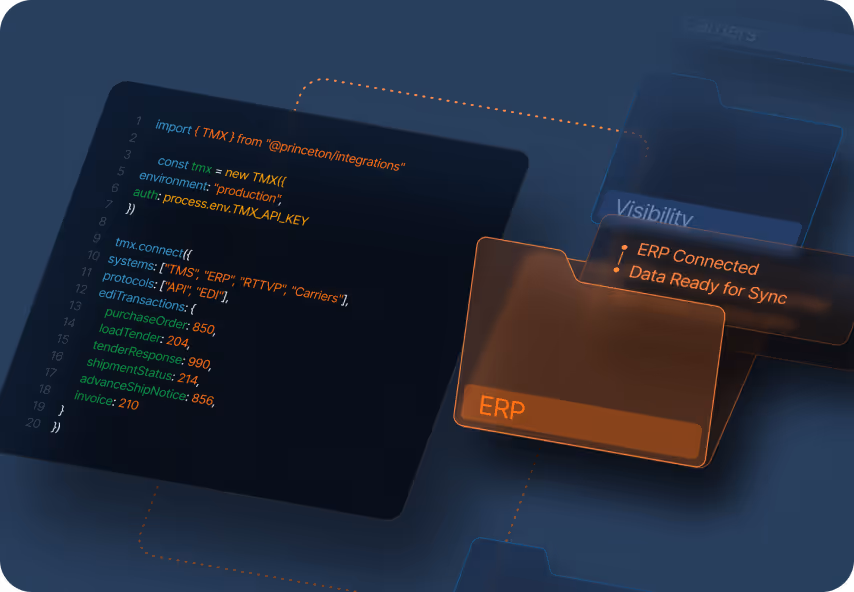
System Integrations
Easily integrate with enterprise resource planning, visibility, procurement, benchmarking, carrier systems, and more, enabling a single source of execution for your transportation teams.
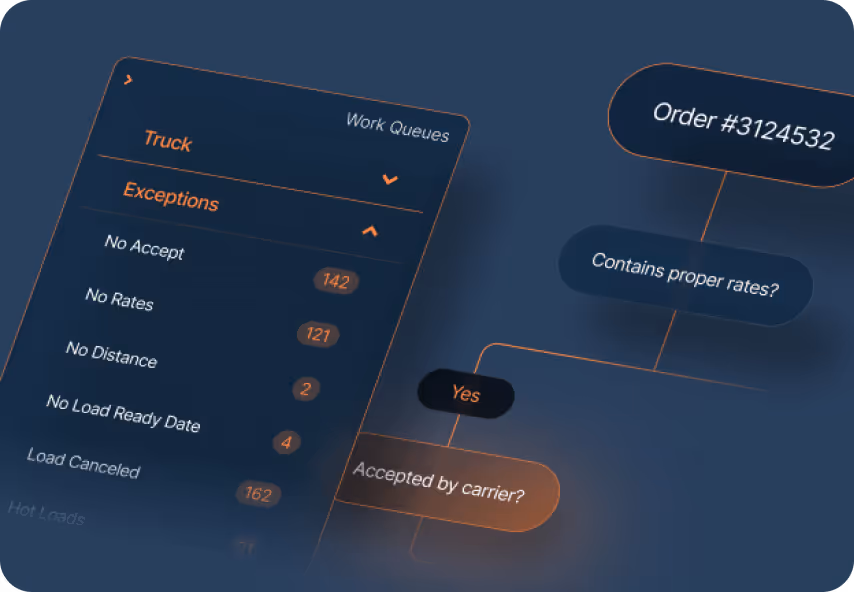
Exception Management
Gain visibility into every disruption, from delays, missed tenders, failed pickups, and more, into one centralized workflow.
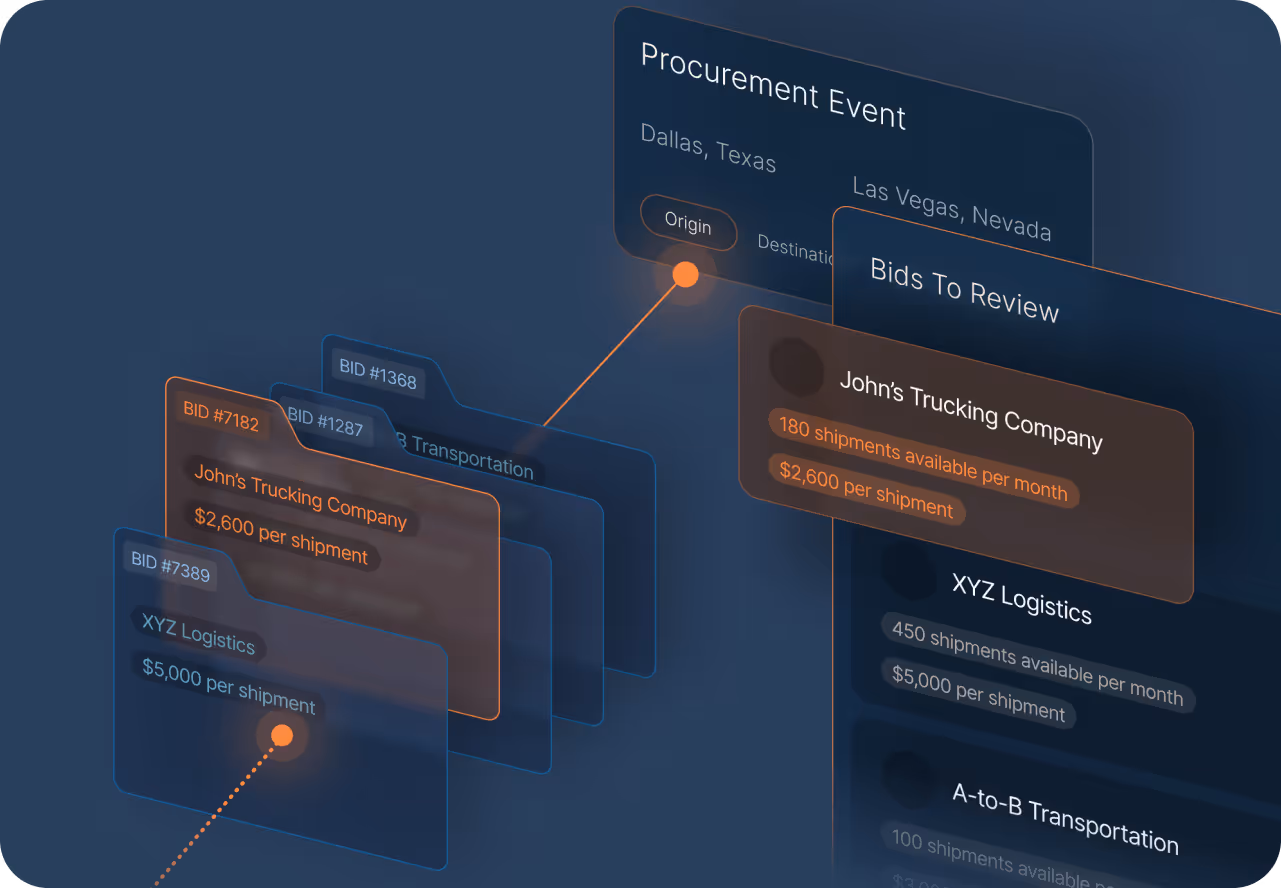
Procurement Events
Secure the best rates and service across every lane by centralizing data, automating communication, and empowering teams with AI-enabled insights.
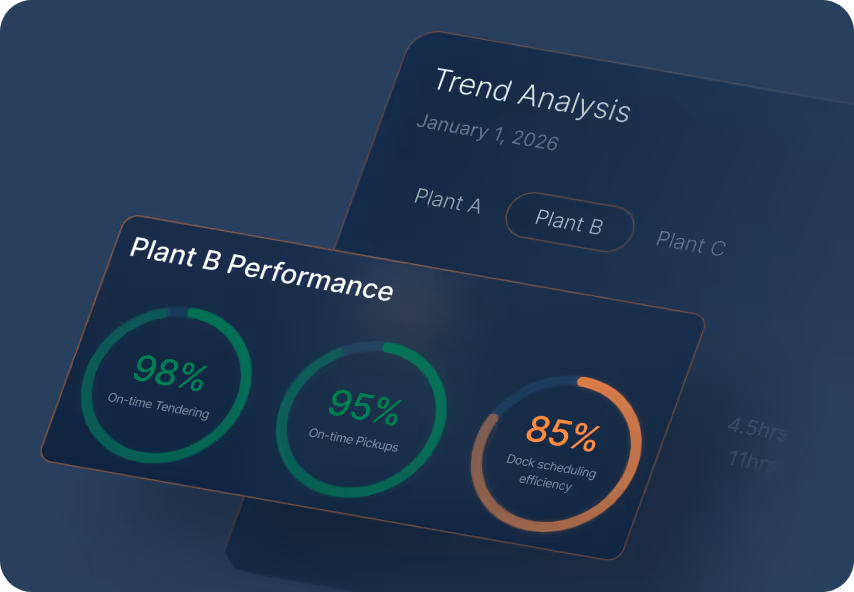
Origin & Plant Performance
Gain clear, data-driven visibility into how each origin, plant, and location operates, helping you optimize origin behavior for both cost and service improvements.
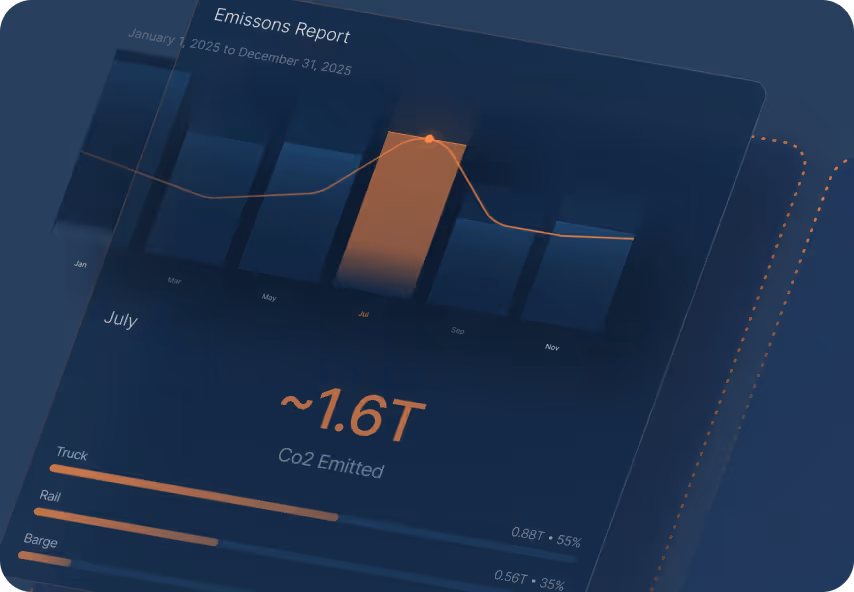
Sustainability Reporting
Meet increasingly complex regulatory and customer expectations by surfacing audit-ready sustainability insights.
Carrier Performance
Unlock objective, real-time insights into how every carrier performs across cost, service, capacity, and compliance, empowering stronger partnerships and higher reliability.