

Run faster, data-driven sourcing events
Secure the best rates and service across every lane by centralizing data, automating communication, and empowering teams with actionable intelligence
Source better capacity, faster


Run sourcing events with ease
Simplify complex procurement cycles with solutions designed to automate every step of the process, from inviting carriers to awarding lanes
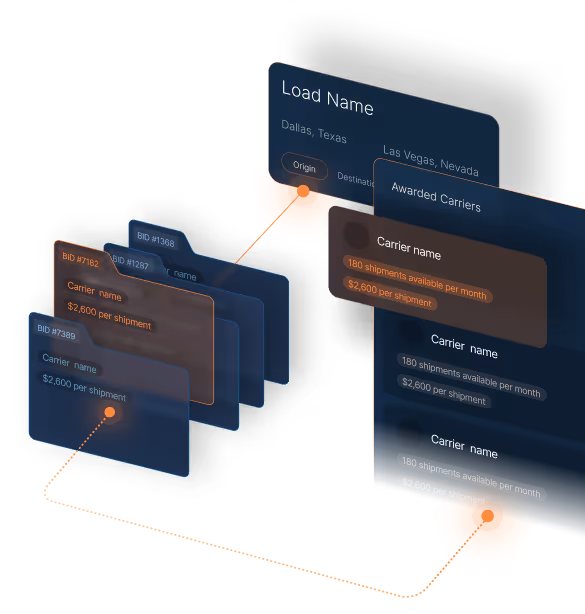
- Launch events in minutes — build RFPs, mini-bids, and spot events using pre-loaded lane data and templates
- Standardize participation and responses — ensure carriers submit rates in consistent, comparable formats
- Streamline collaboration — share event progress with stakeholders while keeping procurement fully in control

Simplify bidding for carriers
Improve response rates and engagement by giving carriers a clean, intuitive way to submit bids and communicate
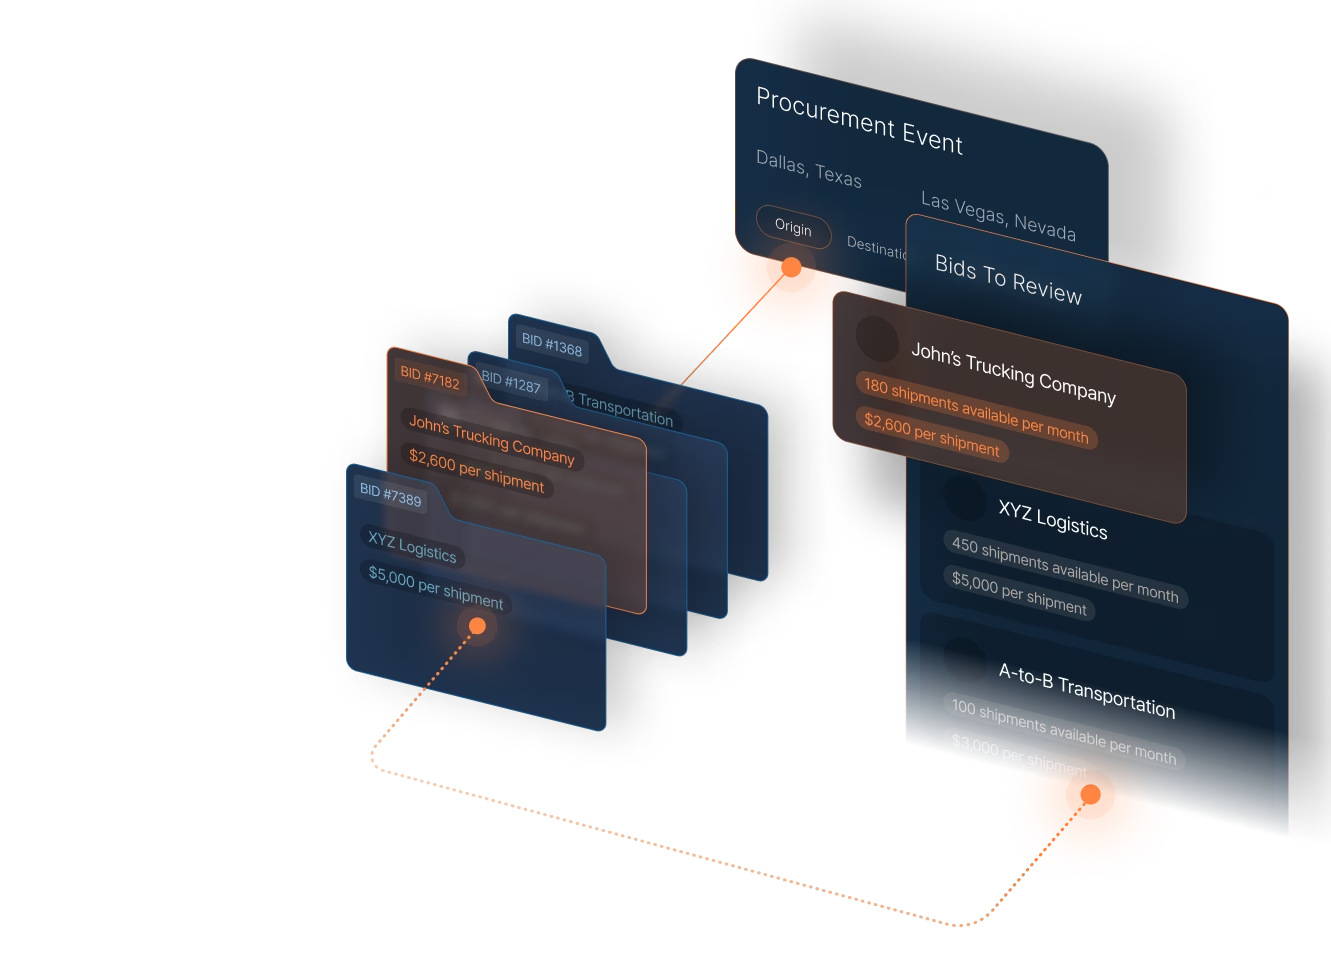
- Easy-to-use carrier portal — carriers enter rates, capacity, and notes directly through a guided interface
- Automated notifications — keep carriers informed with reminders, updates, and deadline alerts
- Transparent expectations — clearly communicate requirements, timelines, and award criteria
Gain more negotiating power
Equip your team with the insights and leverage they need to secure the most competitive rates and service levels from every carrier
- Benchmark rates across your network — compare proposed pricing against historical performance and industry averages
- Leverage real-time market intelligence — use dynamic rate data and trends to guide negotiations with confidence
- Drive strategic conversations with carriers — present fact-based insights that align expectations, correct outliers, and foster long-term cost savings
From bid to execution in minutes
Move from final bid selection to operational readiness without manual steps or data loss
- Auto-generate award recommendations –– create award packages based on cost, service, and strategic criteria
- From rates to routing guides –– push rates directly into routing guides and ensure carriers are ready to tender on day one
- Maintain audit-ready documentation –– keep historical bid data, decisions, and approvals in one system


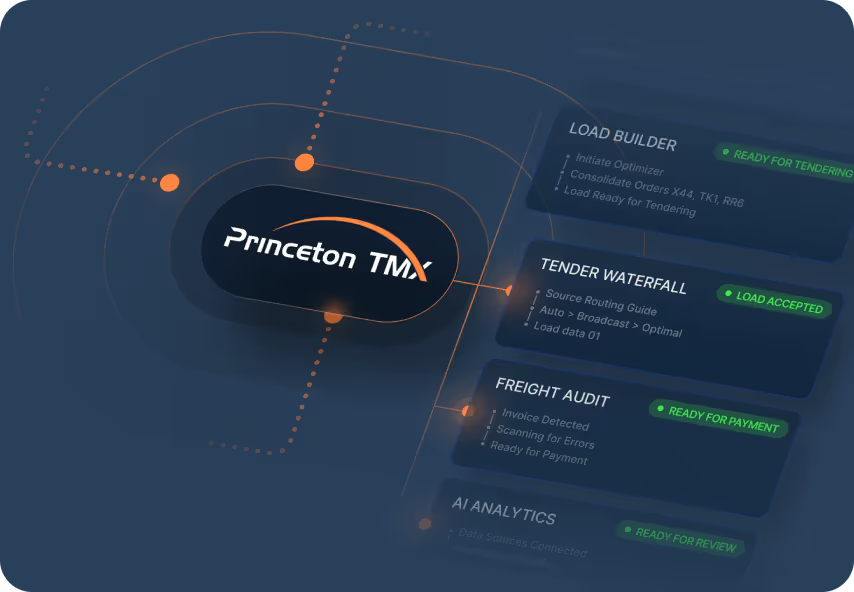
One platform for all your tech


Unify Workflows
All modules, data points, and teams work together to eliminate silos and minimize disruptions.

Real-Time Data
Every shipment update flows instantly across teams, carriers, and partners.

End-to-End Visibility
From planning to analytics, the entire shipment lifecycle stays connected.

Scale Operations
Configurable infrastructure allows you to operate across teams, locations, and modes without adding complexity.
Trusted by leading shippers

"Load tendering, which previously involved manual emails and data entry, now operates with minimal human intervention"

"They're helping make our supply chain more strategic and data-driven. We have folks across our business asking to see the data that our TMS is showing us—it's that valuable across our entire organization."

"Today, we have clear, real-time control over deliveries because of Princeton TMX."
Real shippers. Real results.
Learn how industry leading shippers are reducing costs, improving visibility, and gaining control of their freight with Princeton TMX's Unified Transportation Management System
Discover more solutions from Princeton TMX
Workflow Automation
Eliminate manual workload and errors with AI and automation that streamline every part of your transportation management process.
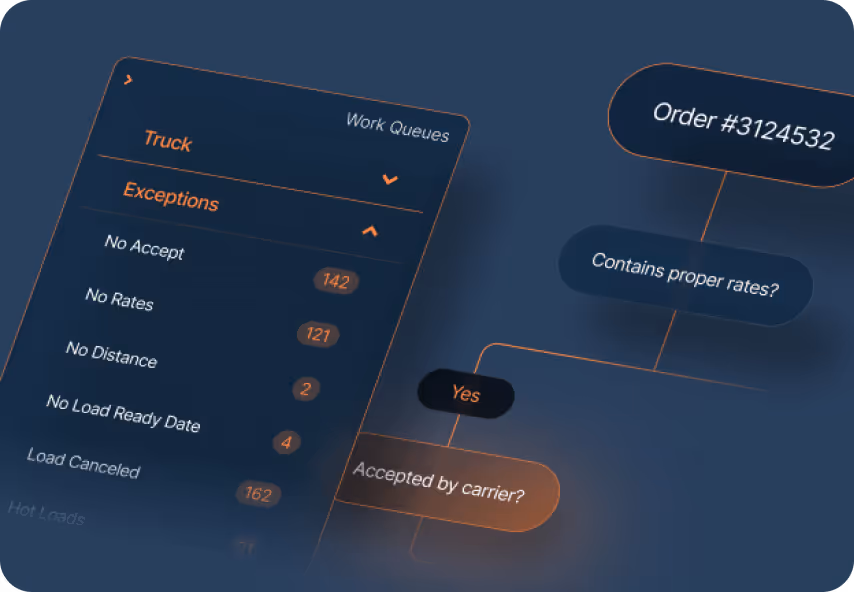
Exception Management
Gain visibility into every disruption, from delays, missed tenders, failed pickups, and more, into one centralized workflow.
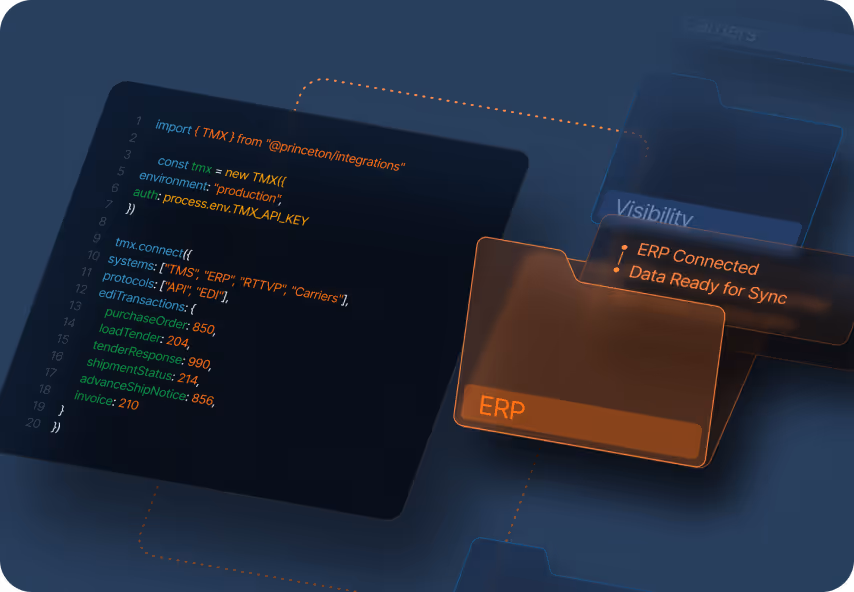
System Integrations
Easily integrate with enterprise resource planning, visibility, procurement, benchmarking, carrier systems, and more, enabling a single source of execution for your transportation teams.
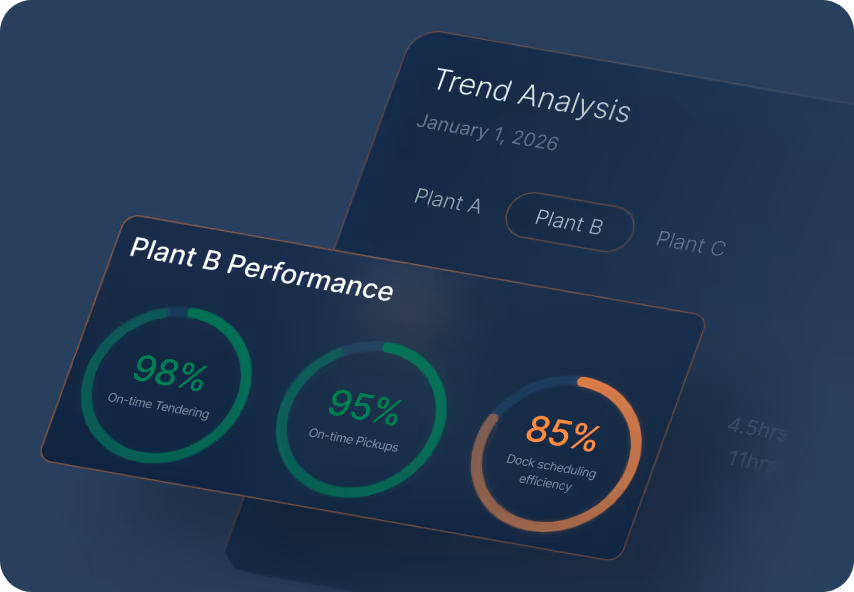
Origin & Plant Performance
Gain clear, data-driven visibility into how each origin, plant, and location operates, helping you optimize origin behavior for both cost and service improvements.

Sustainability Reporting
Meet increasingly complex regulatory and customer expectations by surfacing audit-ready sustainability insights.
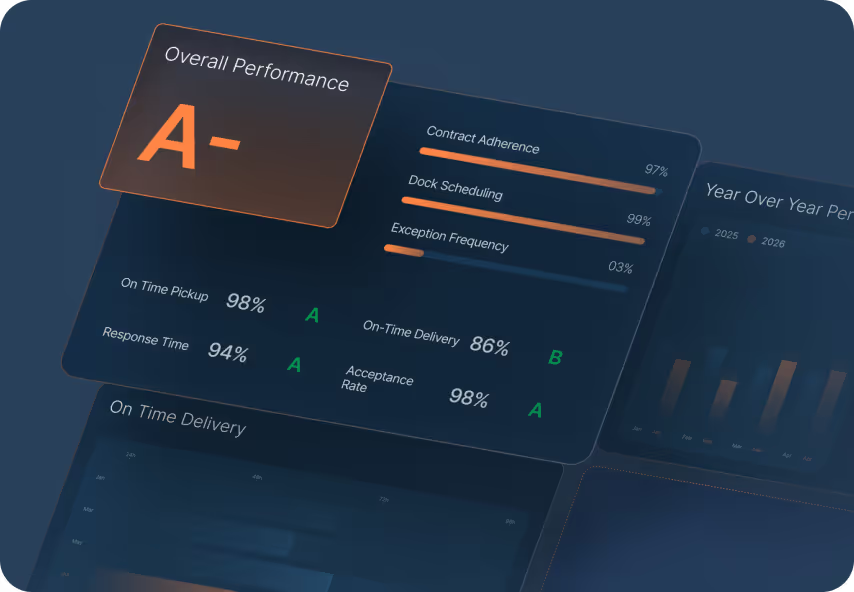
Carrier Performance
Unlock objective, real-time insights into how every carrier performs across cost, service, capacity, and compliance, empowering stronger partnerships and higher reliability.