

AI Load Planning Software: Optimize Truck Loads in Seconds
Princeton TMX load planning software maximizes trailer utilization, lowers transportation costs, and minimizes empty miles – automatically building every truckload to follow your business rules with precision.
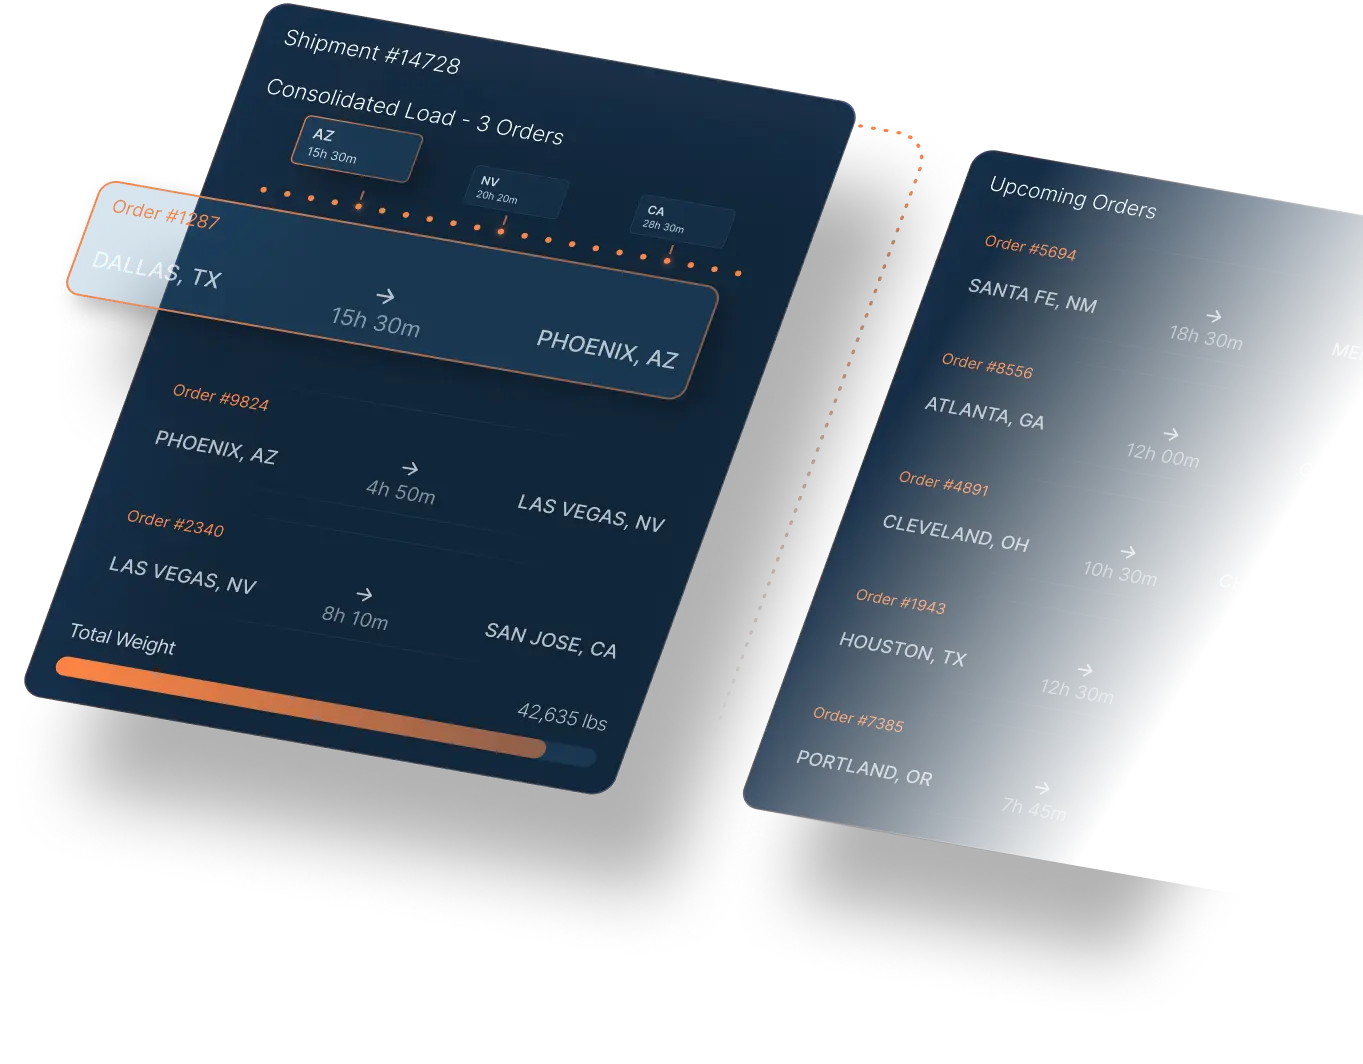
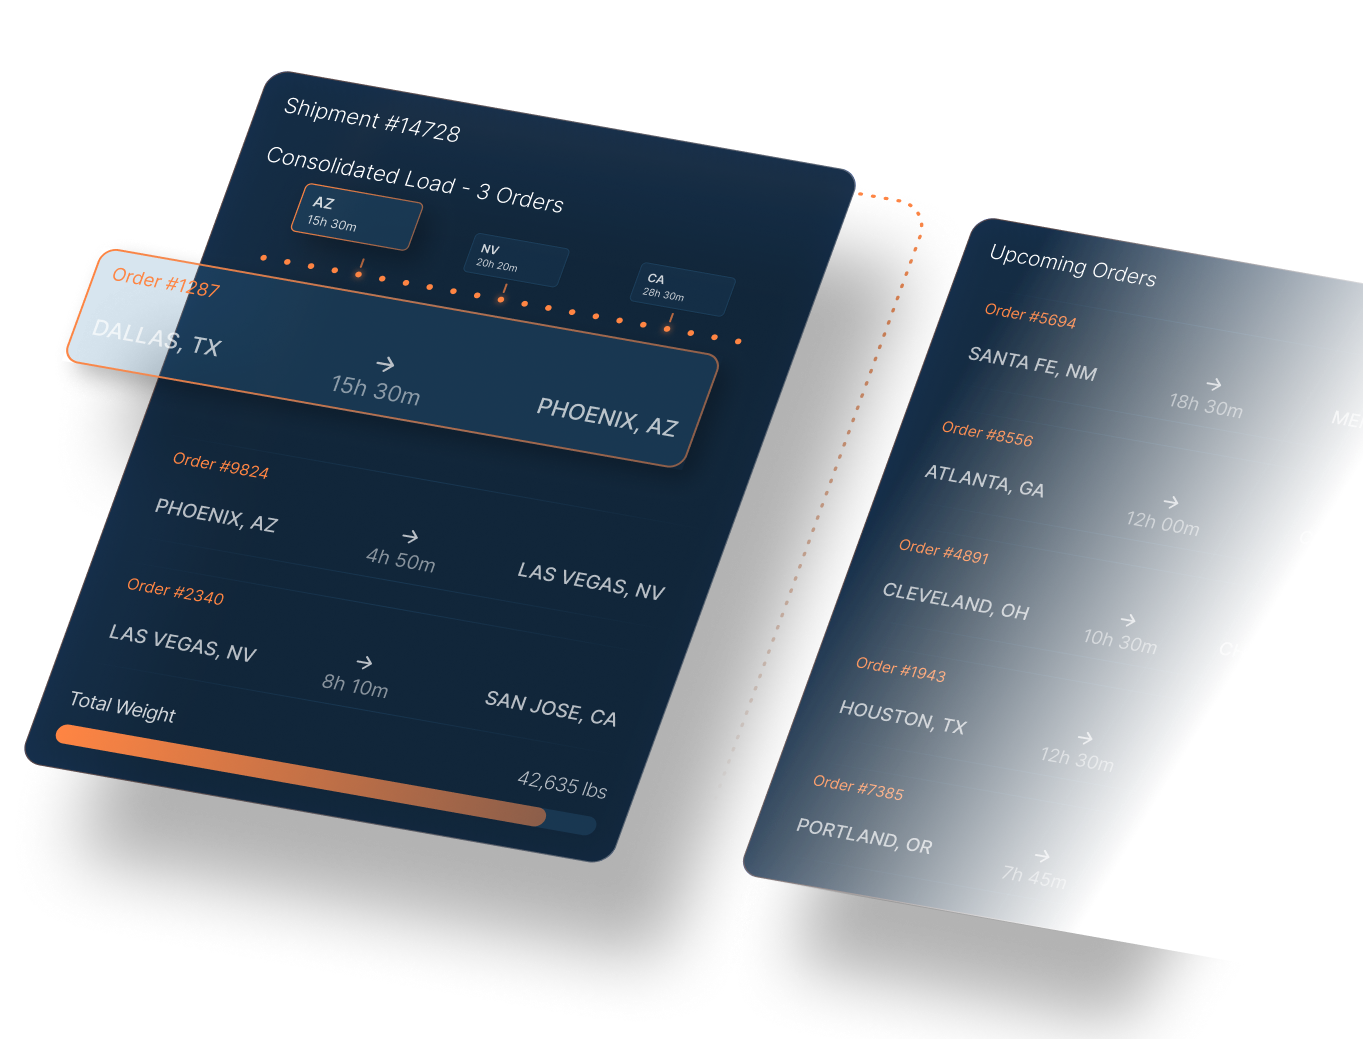
Plan and build loads instantly


Combine orders with precision
Automatically identify the most efficient ways to group orders based on your operational constraints
- Optimize by destination, date, mode, and capacity — create perfectly matched loads that reduce empty miles and increase carrier utilization
- Respect customer and product requirements — adhere to guidelines on temperature, compatibility, delivery windows, and more
- Reduce manual decision-making — evaluate thousands of possible combinations instantly, ensuring every load is built efficiently

Build loads that meet your specific business requirements
Ensure every load follows the standards, preferences, and constraints unique to customer and internal requirements
- No code logic — configure rules for order mix, trailer type, carrier preference, and service levels without writing a line of code
- Auto-trigger load creation — generate loads automatically based on inventory readiness, cutoff times, or customer priorities
- Eliminate errors and inconsistencies — reduce manual intervention and ensure every load is built the right way

Balance carrier capacity and cost automatically
Use actionable intelligence to reduce transportation spend without compromising on service levels
- Optimize capacity utilization — avoid underfilled, oversized, or inefficient loads that drive up empty miles
- Load structure — evaluate and select costs across modes, routes, and carriers
- Prevent avoidable charges — avoid premature tendering or unnecessary split shipments

Refine load plans with total control
Empower your team with the insights and control they need to fine-tune load planning decisions
- Easily adjust or override recommendations — maintain full human control over automated decisions
- Track performance over time — monitor utilization, reduction in empty-miles, and cost savings generated by optimization


What is load planning software?
Load planning software is a transportation management tool that automatically decides how orders are grouped, sequenced, and assigned to trucks so every shipment moves at the lowest cost while meeting your service and compliance rules. Instead of planners building loads by hand in spreadsheets, the software evaluates thousands of order combinations against constraints like destination, delivery window, mode, trailer capacity, and product compatibility, then recommends the most efficient, fully compliant load plan in seconds.
Princeton TMX’s AI load planning software goes further than a traditional load builder: it continuously optimizes truck loads against your live order pool and business rules, reducing empty miles, increasing trailer utilization, and removing the manual decision-making that slows planning teams down.
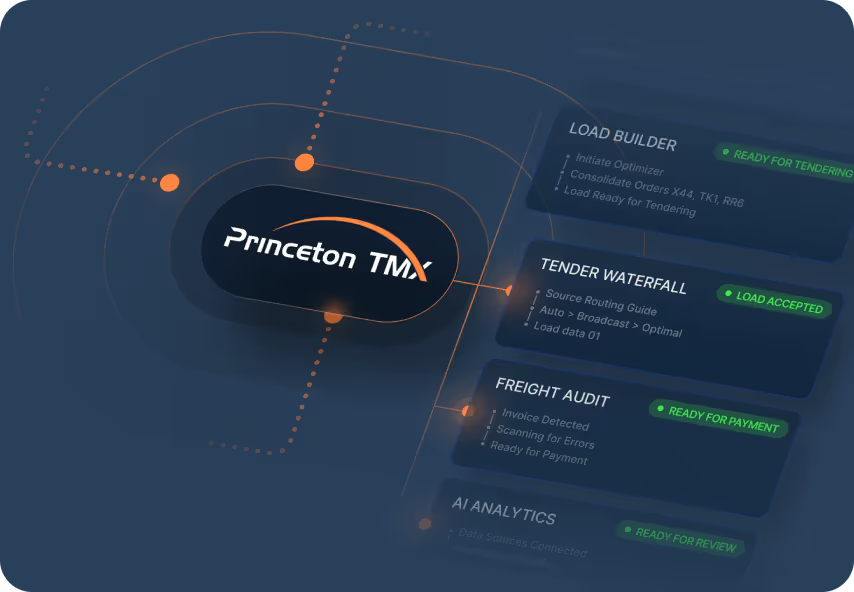
One platform for all your tech


Unify Workflows
All modules, data points, and teams work together to eliminate silos and minimize disruptions.

Real-Time Data
Every shipment update flows instantly across teams, carriers, and partners.

End-to-End Visibility
From planning to analytics, the entire shipment lifecycle stays connected.

Scale Operations
Configurable infrastructure allows you to operate across teams, locations, and modes without adding complexity.
Trusted by leading shippers

"Load tendering, which previously involved manual emails and data entry, now operates with minimal human intervention"

"They're helping make our supply chain more strategic and data-driven. We have folks across our business asking to see the data that our TMS is showing us—it's that valuable across our entire organization."

"Today, we have clear, real-time control over deliveries because of Princeton TMX."
Real shippers. Real results.
Learn how industry leading shippers are reducing costs, improving visibility, and gaining control of their freight with Princeton TMX's Unified Transportation Management System
Discover more solutions from Princeton TMX
Workflow Automation
Eliminate manual workload and errors with AI and automation that streamline every part of your transportation management process.
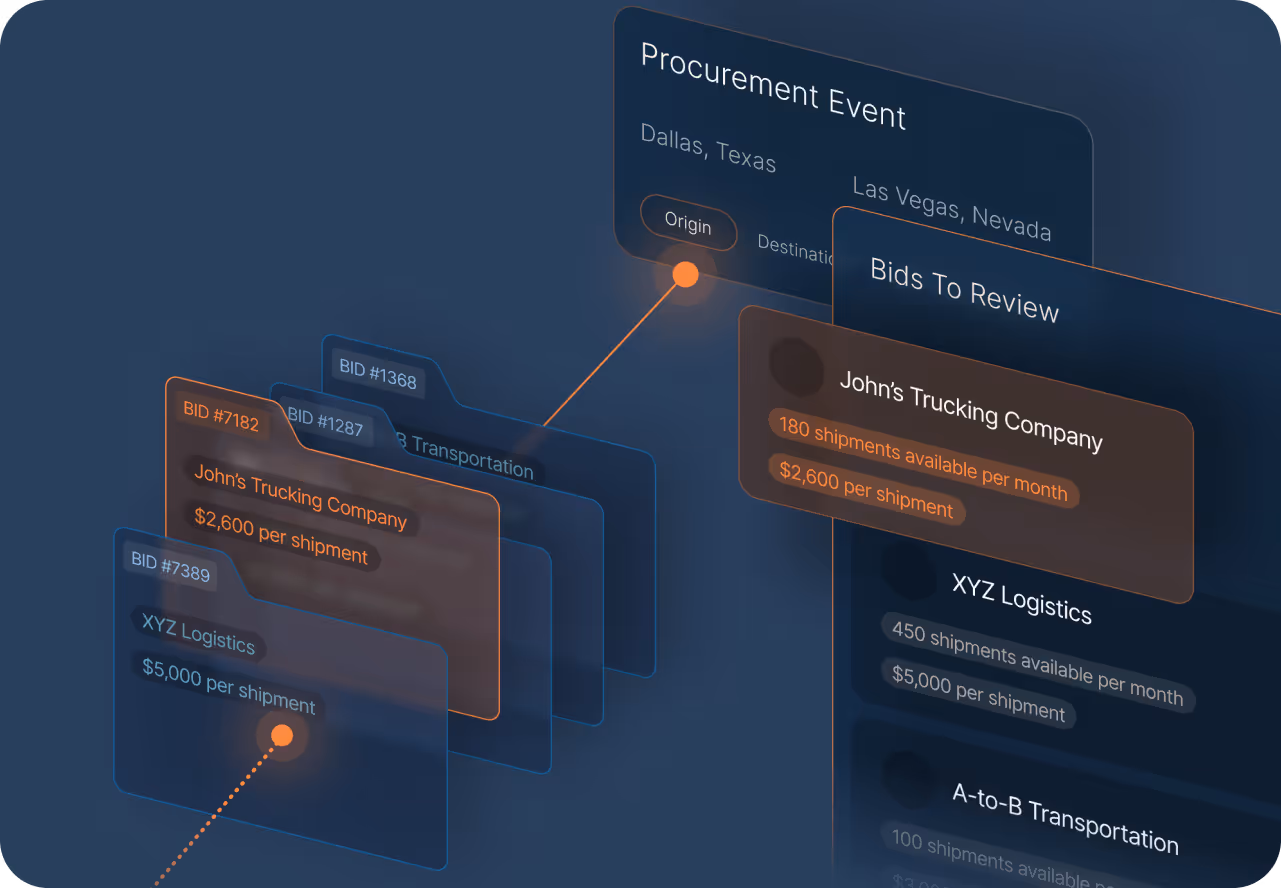
Procurement Events
Secure the best rates and service across every lane by centralizing data, automating communication, and empowering teams with AI-enabled insights.
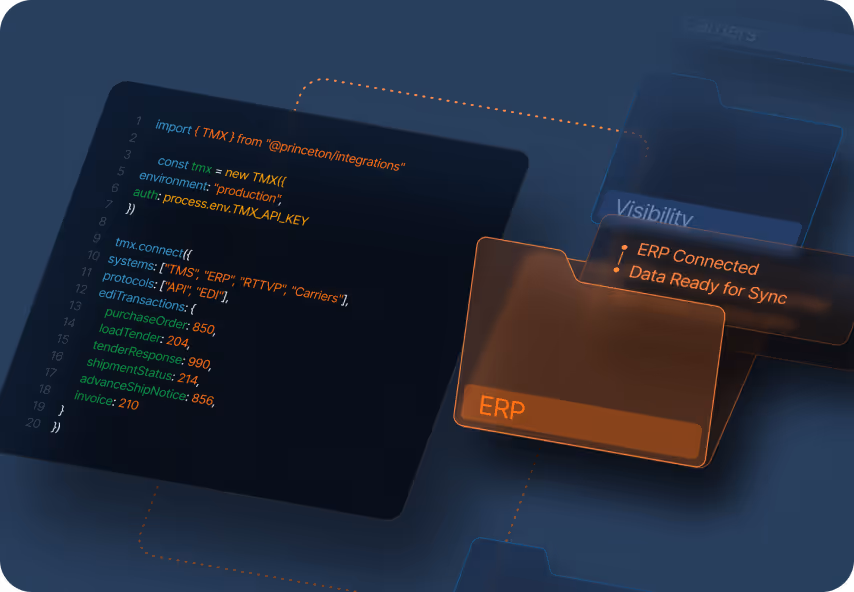
System Integrations
Easily integrate with enterprise resource planning, visibility, procurement, benchmarking, carrier systems, and more, enabling a single source of execution for your transportation teams.
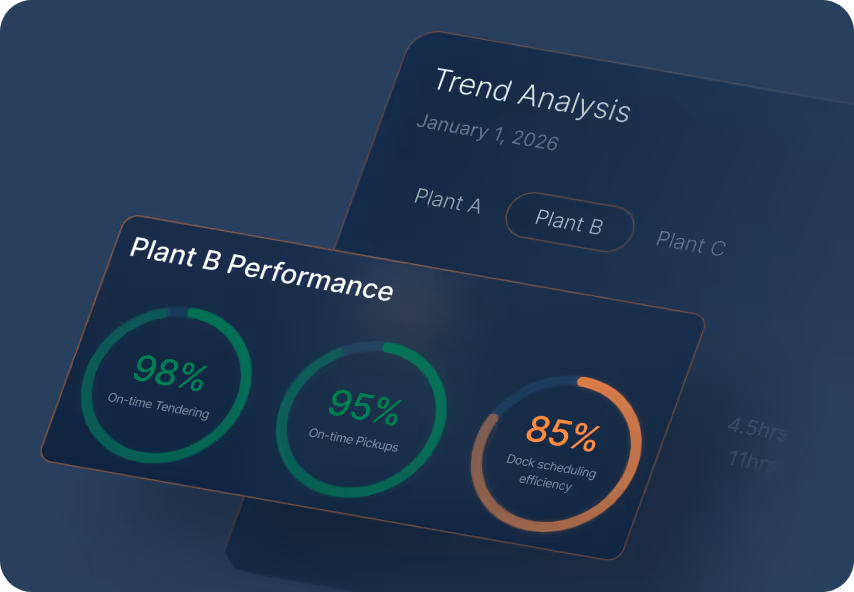
Origin & Plant Performance
Gain clear, data-driven visibility into how each origin, plant, and location operates, helping you optimize origin behavior for both cost and service improvements.

Sustainability Reporting
Meet increasingly complex regulatory and customer expectations by surfacing audit-ready sustainability insights.
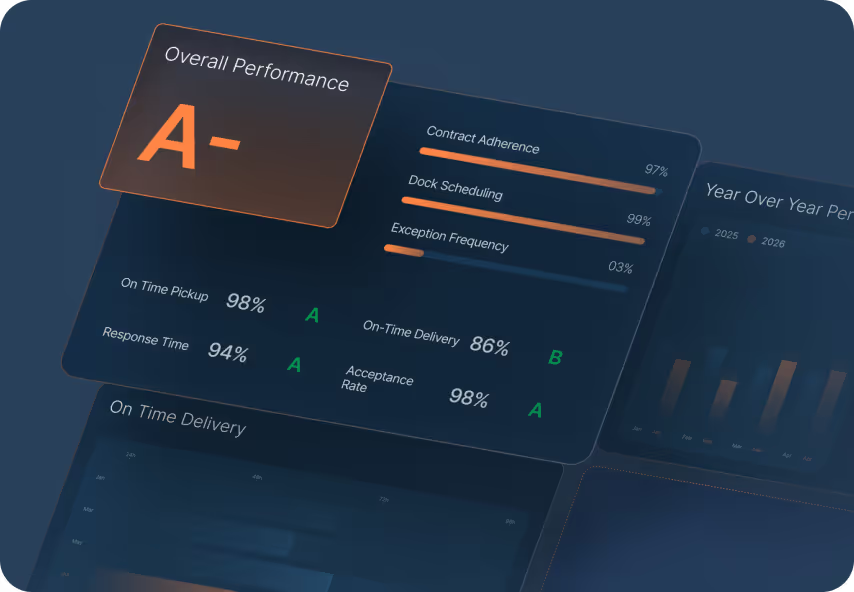
Carrier Performance
Unlock objective, real-time insights into how every carrier performs across cost, service, capacity, and compliance, empowering stronger partnerships and higher reliability.
Load planning software FAQ
Load planning software automatically groups orders into optimized truckloads based on your operational rules – destination, mode, capacity, delivery windows, and product compatibility – to cut costs and reduce empty miles while keeping every load compliant.
AI evaluates thousands of possible order-to-load combinations in seconds, scoring each against your time and service constraints, and recommends the optimal plan. Planners keep full control and can adjust or override any recommendation.
A load builder assembles loads from rules you define. Load optimization software adds a decision layer comparing many valid plans and selecting the highest utilization option automatically. Princeton TMX does both.
Yes. Princeton TMX optimizes truckload (FTL) and LTL planning within a single platform, so consolidations are made together rather than in silos.