

Improve carrier performance with AI Analytics
Unlock objective, real-time insights into how every carrier performs across cost, service, capacity, and compliance, empowering stronger partnerships and higher reliability
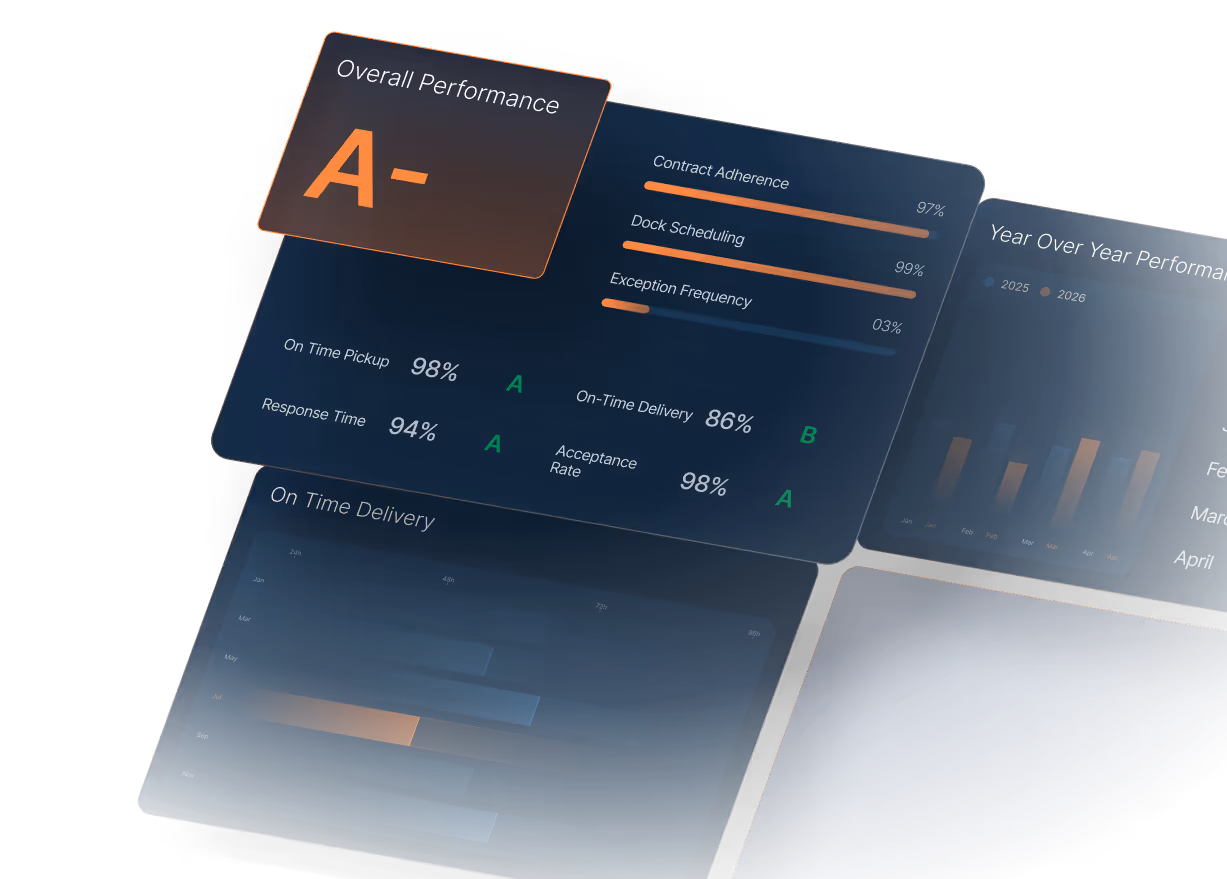
Measure reliability with confidence


Track your most critical service metric in real-time
Get a complete view of how reliably your carriers deliver shipments both on time and to specification
- Track OTIF by lane, region, customer, and mode — see where carriers consistently hit expectations and where service breaks down
- Identify root cause — uncover whether issues stem from carrier behavior, origin delays, routing guide gaps, or capacity constraints
- Measure the downstream impact — quantify how OTIF failures drive rework, penalties, exceptions, and service degradation

Understand how carriers support volume and routing guides
Gain visibility into how reliably carriers accept and execute tenders according to your pre-determined routing guides
- Track acceptance, rejection, and fall-off rates — quickly identify carriers that create tender friction or capacity gaps
- Analyze responsiveness and confirmation times — spot carriers that delay tender flow or create operational uncertainty
- Benchmark tender behavior across your network — understand which carriers can be trusted with increased volume

Ensure carriers actually deliver value
Connect cost insights directly to performance quality for a more complete assessment of value drivers
- Compare actual vs. contract vs. benchmarks — highlight cost variance tied to mode, lane, or carrier
- Detect unexpected accessorials or charges — identify cost leakage tied to behavior, delays, or non-compliance
- Quantify the cost impact of service failures — understand how dwell, late deliveries, and re-routing inflate spend

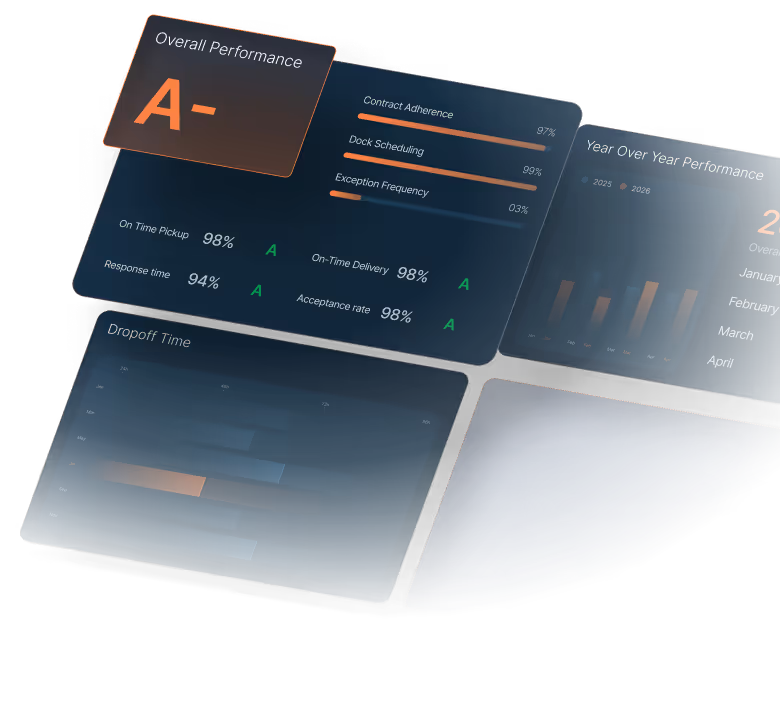
Track carrier performance over time
Track the metrics that highlight operational stability and long-term reliability
- Monitor on-time pickup and delivery performance — compare service quality across carriers, lanes, and time periods
- Identify recurring issues and trends — reveal carriers with declining performance or improving reliability
- Spot leading indicators of future risk — exceptions, delayed confirmations, dwell spikes, and capacity shortfalls


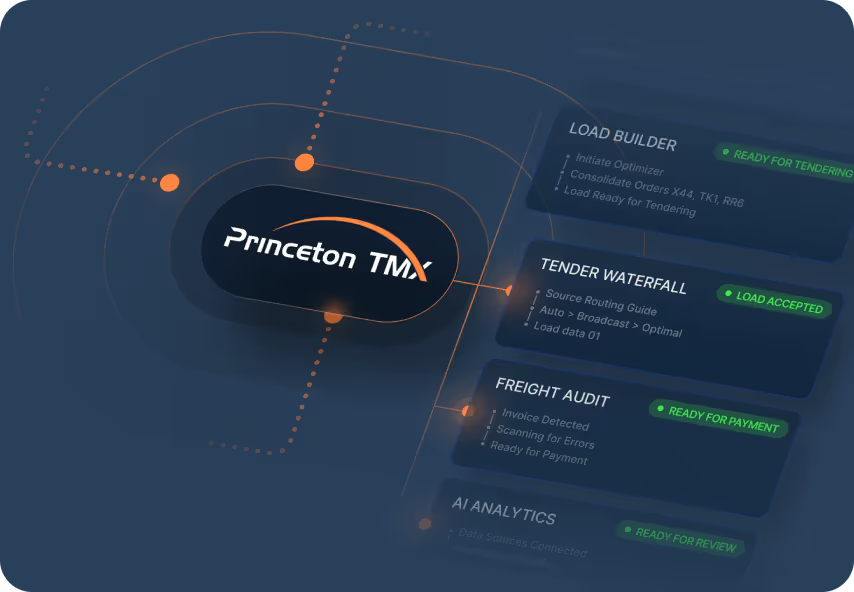
One platform for all your tech


Unify Workflows
All modules, datapoints, and teams work together to eliminate silos and minimize disruptions.

Real-Time Data
Every shipment update flows instantly across teams, carriers, and partners.

End-to-End Visibility
From planning to analytics, the entire shipment lifecycle stays connected.

Scale Operations
Configurable infrastructure allows you to operate across teams, locations, and modes without adding complexity.
Trusted by leading shippers

"Load tendering, which previously involved manual emails and data entry, now operates with minimal human intervention"

"They're helping make our supply chain more strategic and data-driven. We have folks across our business asking to see the data that our TMS is showing us—it's that valuable across our entire organization."

"Today, we have clear, real-time control over deliveries because of Princeton TMX."
Real shippers. Real results.
Learn how industry leading shippers are reducing costs, improving visibility, and gaining control of their freight with Princeton TMX's Unified Transportation Management System
Discover more solutions from Princeton TMX
Workflow Automation
Eliminate manual workload and errors with AI and automation that streamline every part of your transportation management process.
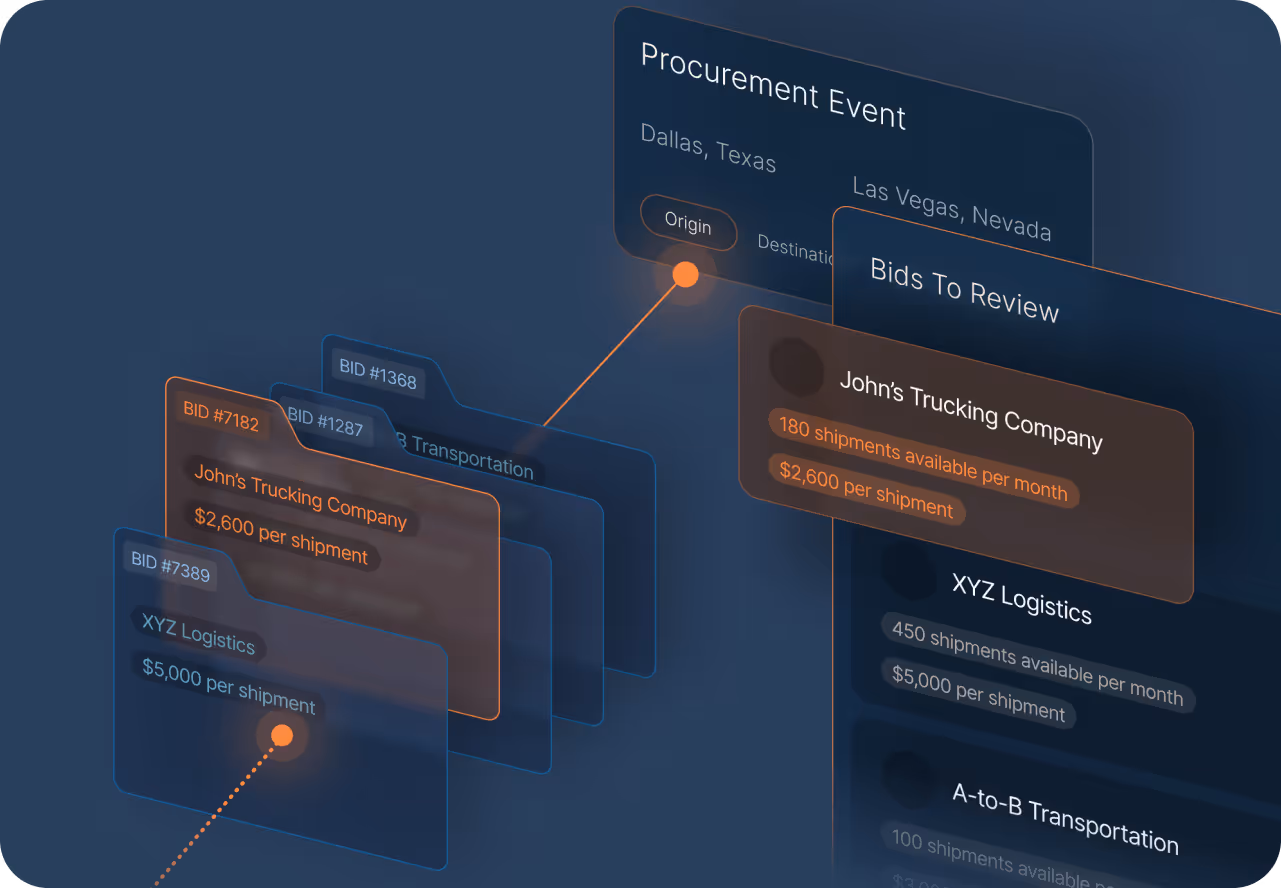
Procurement Events
Secure the best rates and service across every lane by centralizing data, automating communication, and empowering teams with AI-enabled insights.
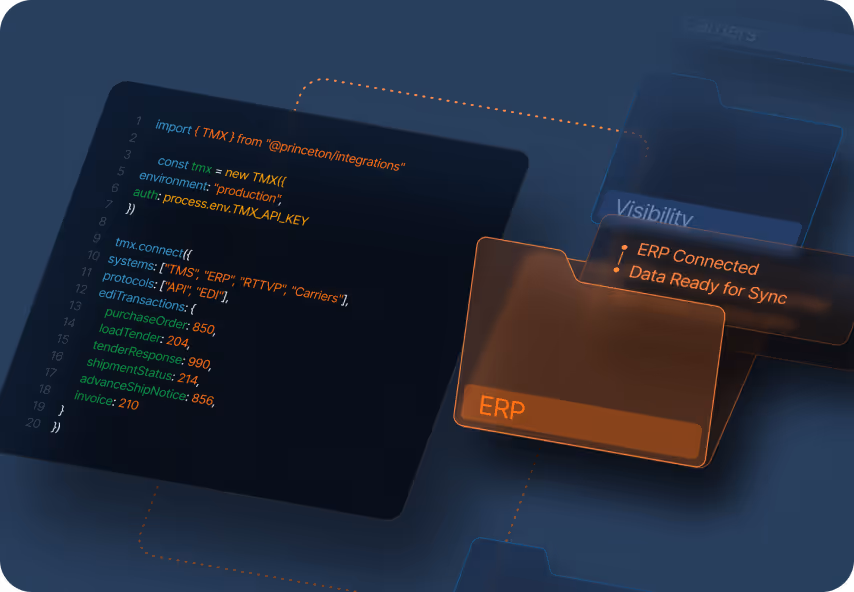
System Integrations
Easily integrate with enterprise resource planning, visibility, procurement, benchmarking, carrier systems, and more, enabling a single source of execution for your transportation teams.
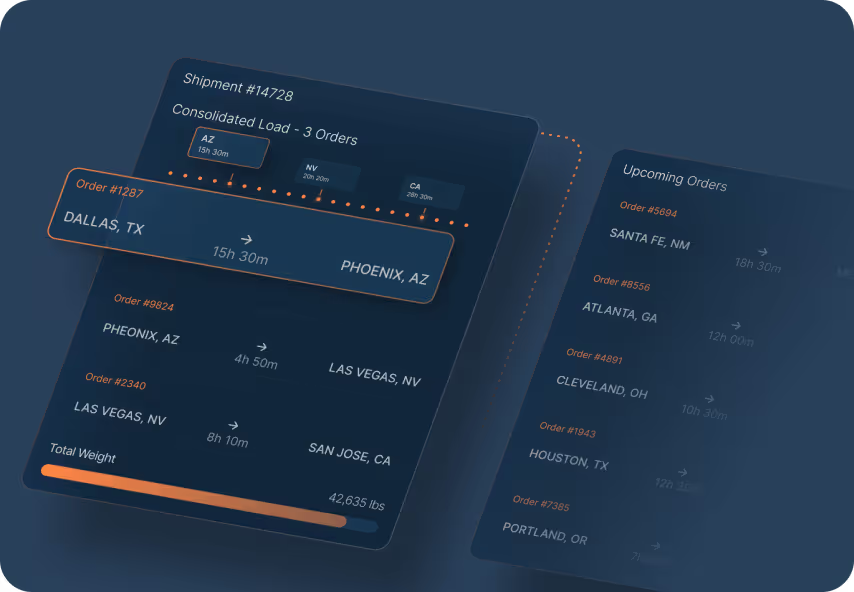
Load Builder Optimization
Maximize utilization, lowering transportation costs, and minimize empty miles by ensuring every load follows your business rules with precision.
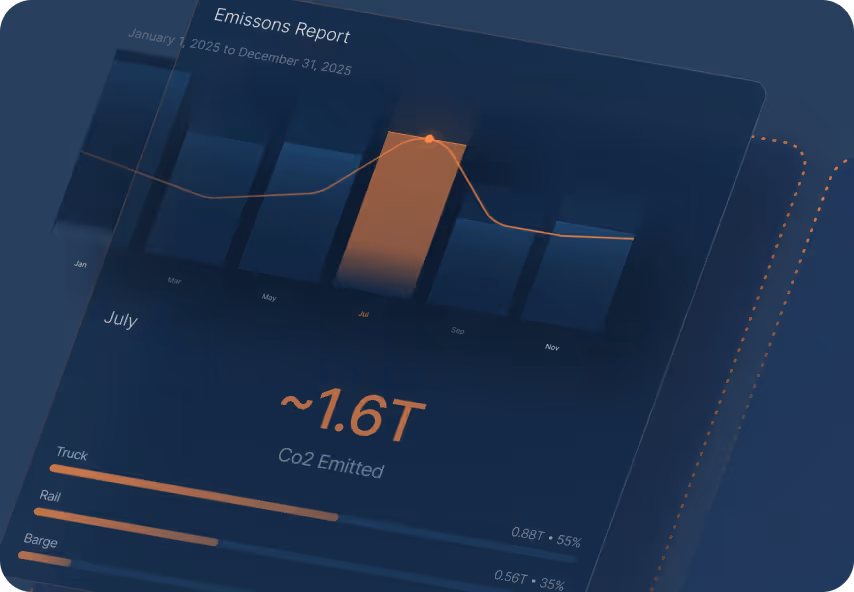
Sustainability Reporting
Meet increasingly complex regulatory and customer expectations by surfacing audit-ready sustainability insights.
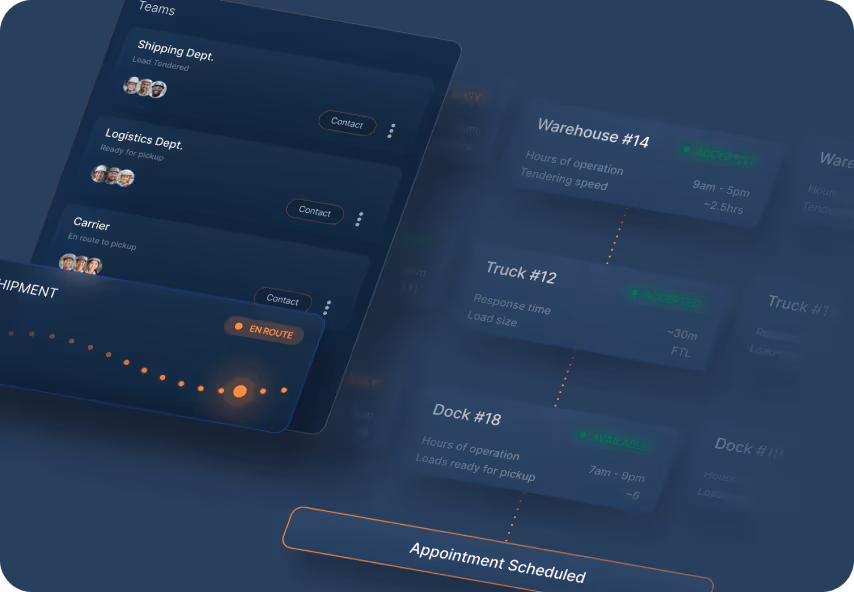
Dock Scheduling
Optimize dock availability, reduce congestion, and keep your facilities running on schedule with unified dock scheduling across all your locations.