


Set and enforce compliance with ease
Reduce leakage, improve performance, and protect your transportation budget with real-time compliance controls that automatically enforce rates, routing guides, and tendering rules
Automate compliance across every mode, carrier, and shipment


Prevent billing and charge disputes
Ensure every shipment uses the correct contracted rates before tenders are accepted or invoices arrive
- Validate rates in real time — automatically check accessorials, lane pricing, and mode-specific rules against your contracts
- Stop cost leakage before it starts — prevent shipments from routing to carriers with expired or incorrect rates
- Enforce your pricing strategy — ensure consistent application of negotiated discounts and incentives

Ensure shipments are accepted on your terms, every time
Guarantee that every load is tendered to the right carrier, in the right order, based on your business rules – and built efficiently in the first place with load planning software
- Automate routing guide enforcement — apply sequence, capacity, performance, and rate logic to every tender
- Reduce carrier mis-awards — prevent loads from going to non-compliant or lower-priority carriers
- Improve carrier accountability — track tender acceptance rates, rejections, and exceptions with precision

Keep shipments on the correct path
Ensure carriers follow approved lanes, service levels, and transit expectations
- Monitor carrier adherence to planned routes — identify deviations, alternate lanes, or unapproved transit paths
- Protect service and cost commitments — catch route variances that lead to delays or unexpected charges
- Surface patterns in non-compliance — pinpoint recurring issues by carrier, lane, or region

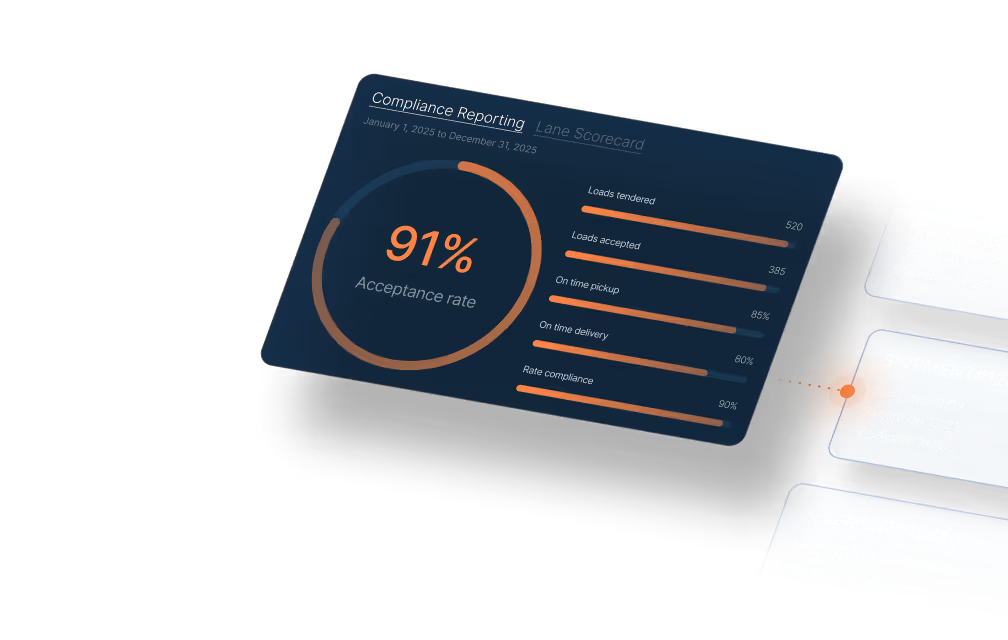
Hold your carriers accountable
Turn compliance data into operational and financial insights your team can act on
- Track compliance scores across carriers — measure rate, tender, and route adherence for every partner
- Quantify the cost of non-compliance — highlight avoidable spend from mis-awarded tenders or rate deviations
- Drive continuous improvement — use insights to refine routing guides, renegotiate rates, or adjust carrier strategies


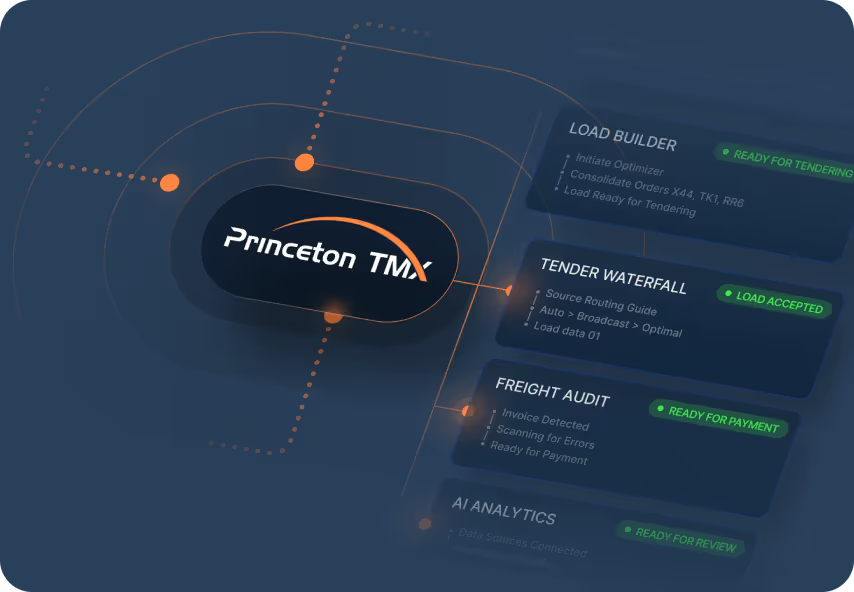
One platform for all your tech


Unify Workflows
All modules, data points, and teams work together to eliminate silos and minimize disruptions.

Real-Time Data
Every shipment update flows instantly across teams, carriers, and partners.

End-to-End Visibility
From planning to analytics, the entire shipment lifecycle stays connected.

Scale Operations
Configurable infrastructure allows you to operate across teams, locations, and modes without adding complexity.
Trusted by leading shippers

"Load tendering, which previously involved manual emails and data entry, now operates with minimal human intervention"

"They're helping make our supply chain more strategic and data-driven. We have folks across our business asking to see the data that our TMS is showing us—it's that valuable across our entire organization."

"Today, we have clear, real-time control over deliveries because of Princeton TMX."
Real shippers. Real results.
Learn how industry leading shippers are reducing costs, improving visibility, and gaining control of their freight with Princeton TMX's Unified Transportation Management System
Discover more solutions from Princeton TMX
Workflow Automation
Eliminate manual workload and errors with AI and automation that streamline every part of your transportation management process.
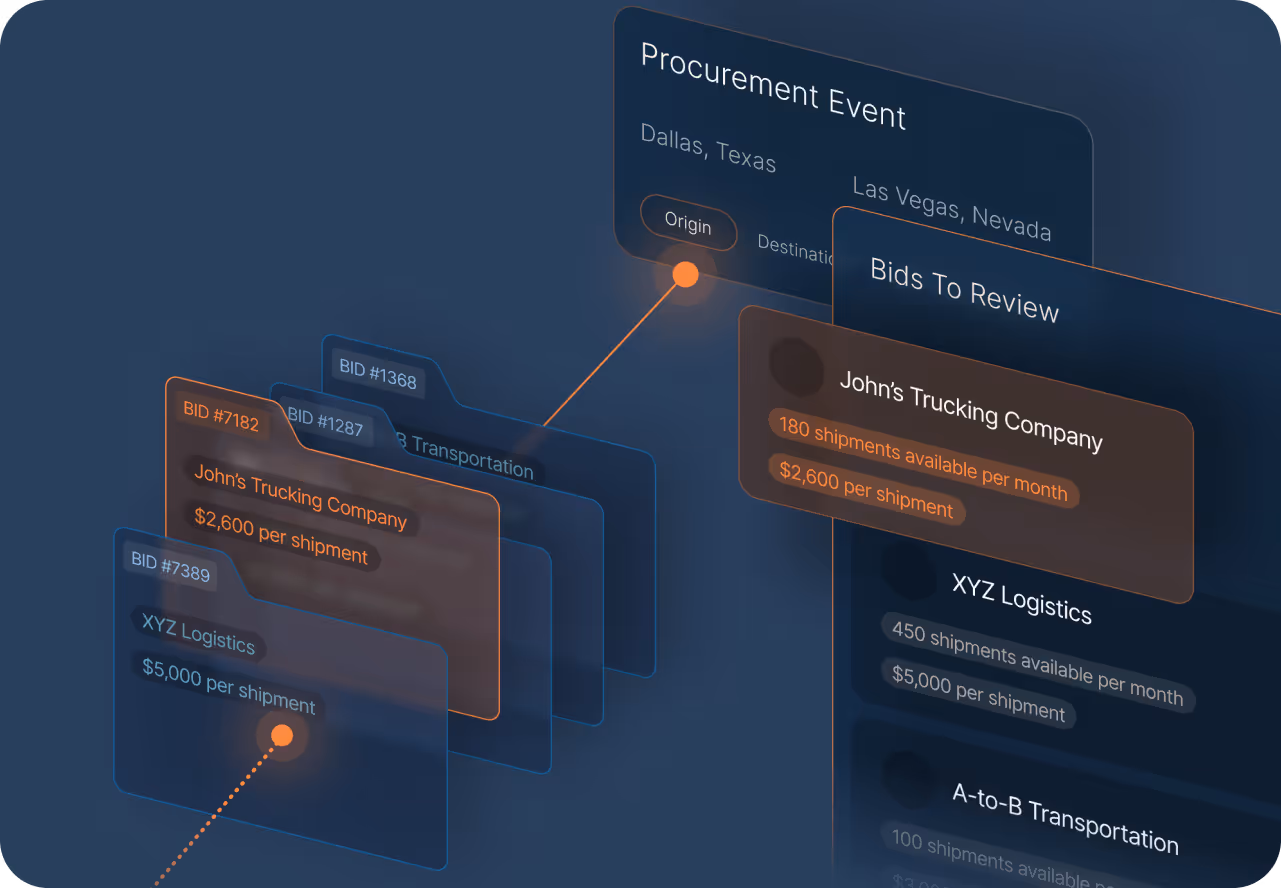
Procurement Events
Secure the best rates and service across every lane by centralizing data, automating communication, and empowering teams with AI-enabled insights.
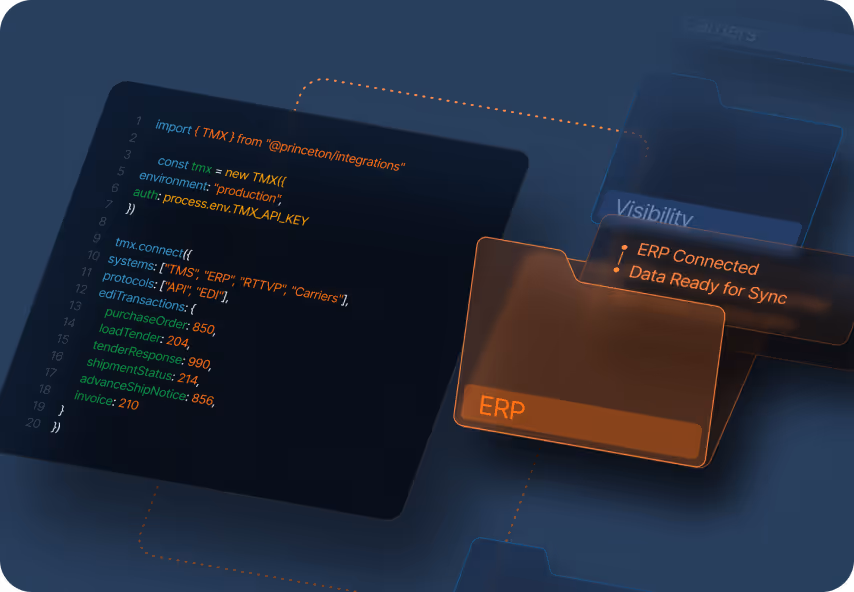
System Integrations
Easily integrate with enterprise resource planning, visibility, procurement, benchmarking, carrier systems, and more, enabling a single source of execution for your transportation teams.
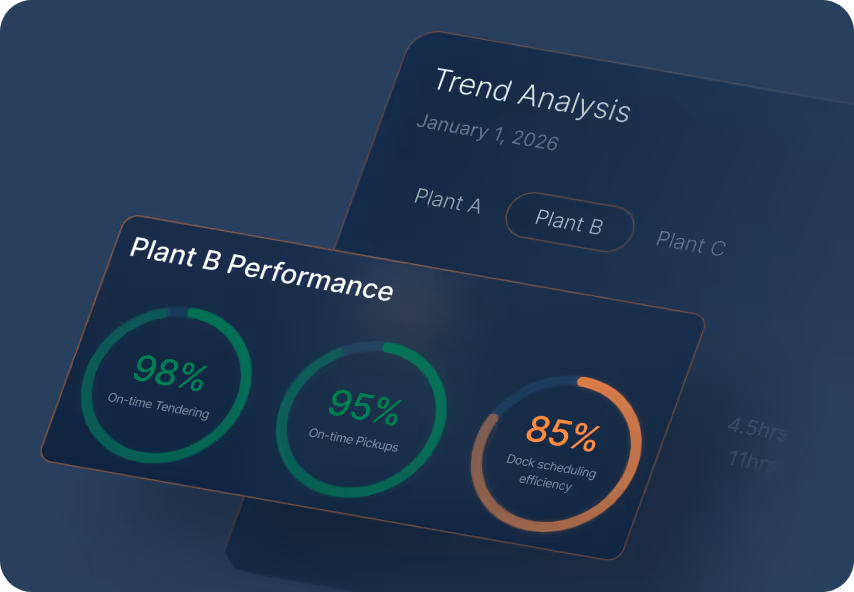
Origin & Plant Performance
Gain clear, data-driven visibility into how each origin, plant, and location operates, helping you optimize origin behavior for both cost and service improvements.

Sustainability Reporting
Meet increasingly complex regulatory and customer expectations by surfacing audit-ready sustainability insights.
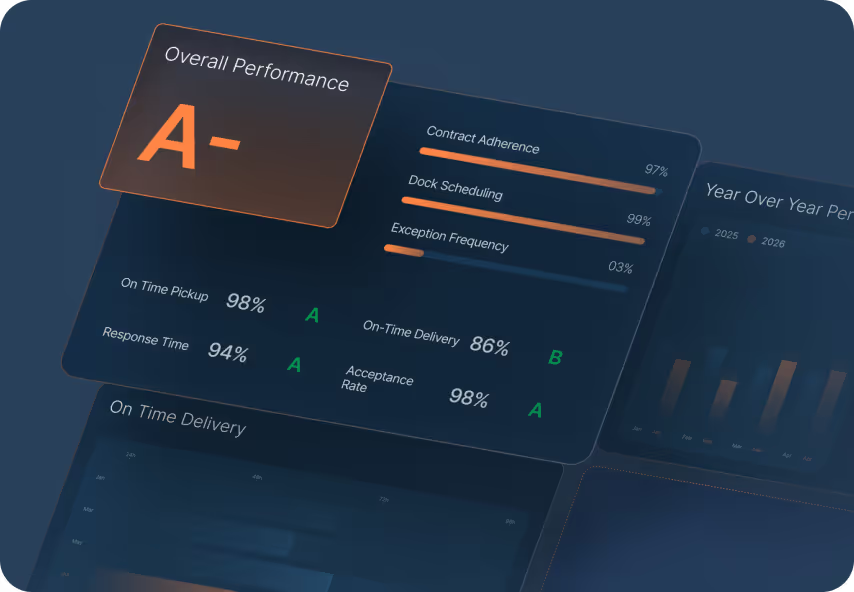
Carrier Performance
Unlock objective, real-time insights into how every carrier performs across cost, service, capacity, and compliance, empowering stronger partnerships and higher reliability.