

Measure lane and spend data with AI Analytics
Gain a unified, data-driven view of lane performance and transportation spend, helping you reduce costs, improve service, and make smarter decisions
Create transparency and trust with your transportation leaders


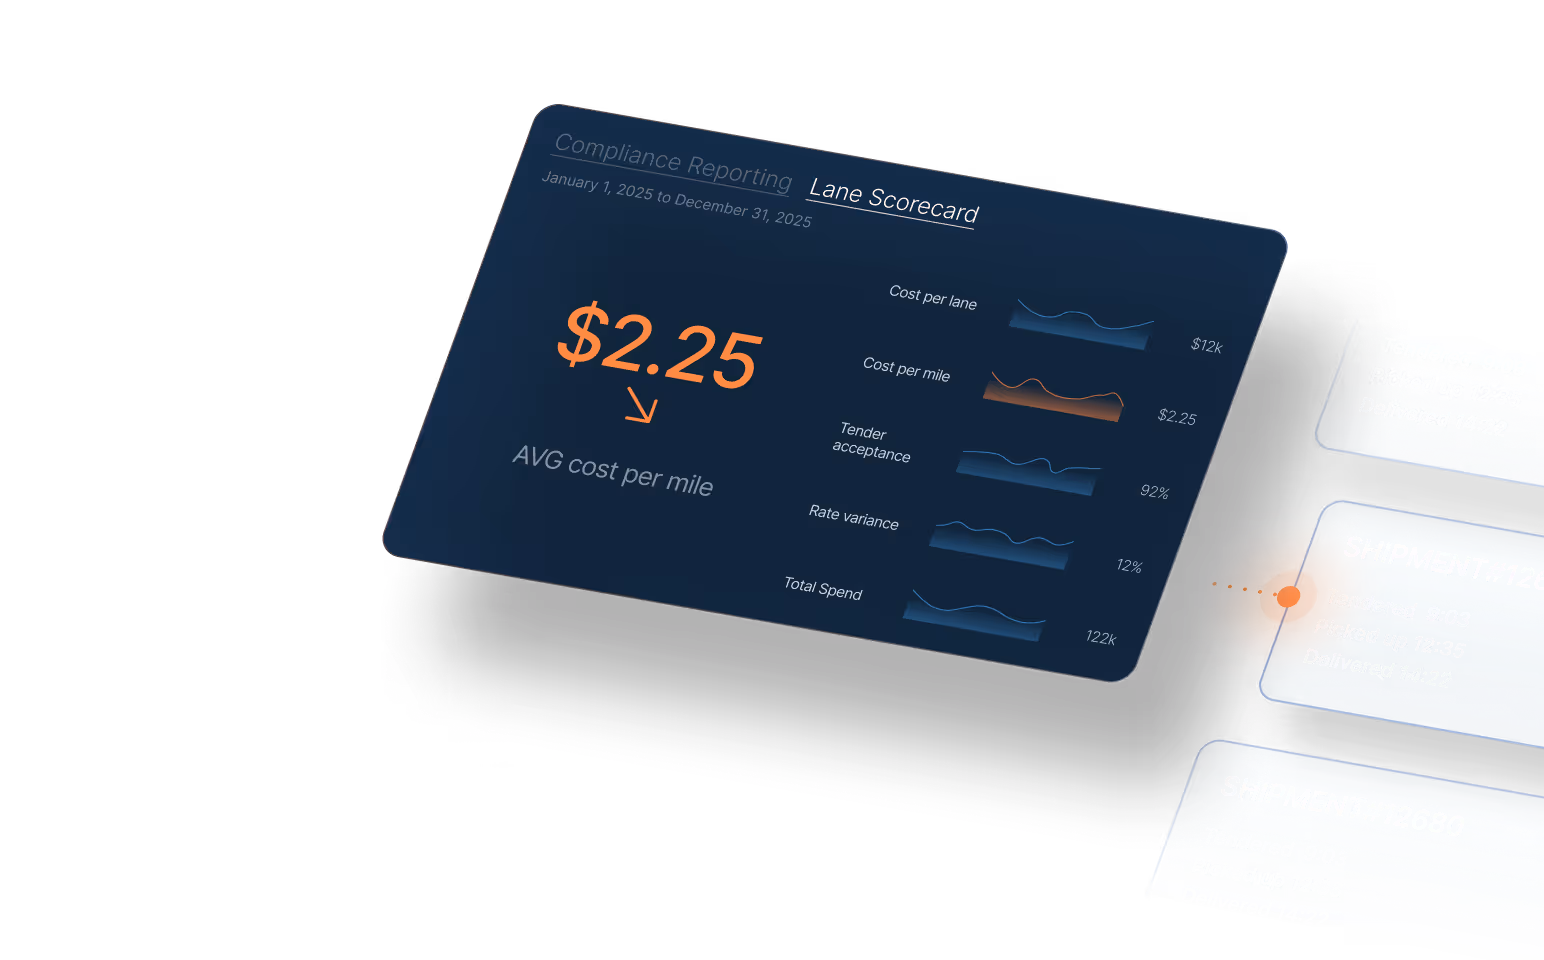
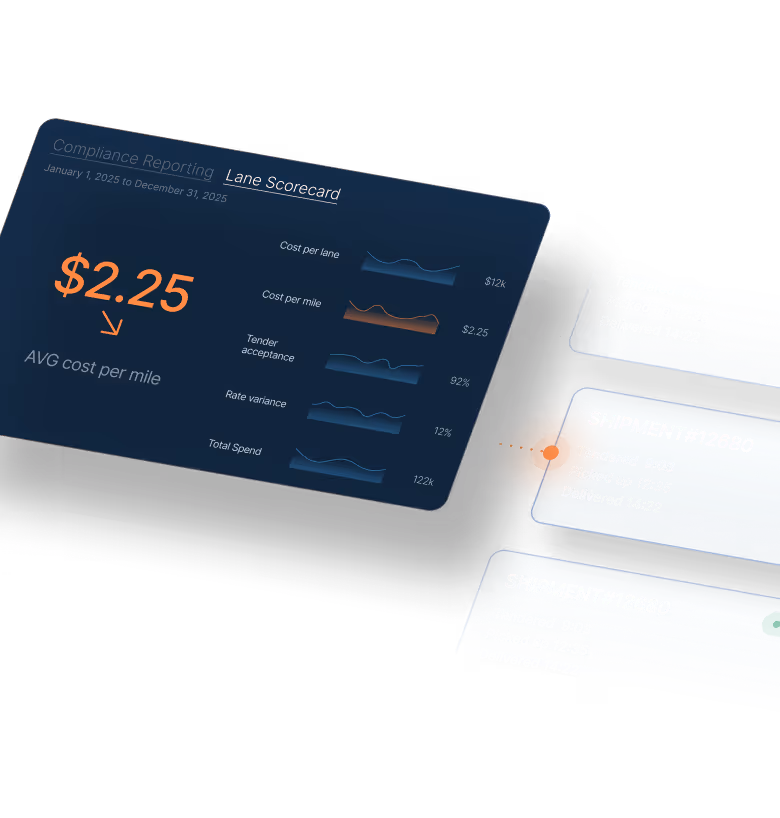
Unlock real-time lane insights
Measure cost, service, and operational health across every lane
- Track on-time performance, dwell time, and service failures — identify your strongest and weakest lanes instantly
- Compare carriers within the same lane — understand who’s performing, who’s struggling, and where opportunities exist
- Monitor trends over time — surface recurring issues tied to seasonality, volume shifts, or network constraints

Track how every dollar moves through your network
Build confidence in your spend data with automated consolidation and normalization
- Centralize costs across modes, carriers, and locations — eliminate fragmented spreadsheets and disconnected tools
- Drill into spend by lane, region, carrier, or customer — uncover patterns that inform strategic sourcing and budgeting
- Spot anomalies and overspending — detect cost variances caused by accessorials, re-routes, or non-compliant charges
- Pair this with freight audit to catch and dispute those charges before they’re ever paid

Plan budgets with confidence
Give finance and operations teams the real-time visibility they need to control costs and plan effectively
- Spend vs. budget analysis — monitor actual vs. planned costs to understand where overruns or efficiencies are occurring
- Forecast cost variance — use historical patterns and real-time trends to anticipate rate changes, capacity constraints, and accessorials
- No surprises — equip teams with transparent insights, enabling smarter decisions, better alignment with finance, and fewer surprises

Turn insights into improvements
Use powerful insights to refine routing guides, optimize load plans, and reduce transportation spend
- Identify high-cost, low-performance lanes — and uncover alternatives that improve reliability or reduce cost
- Detect consolidation and mode-shift opportunities — improve utilization and reduce empty miles across your network
- Enable strategic decision-making — support procurement, operations, and finance with a single source of truth


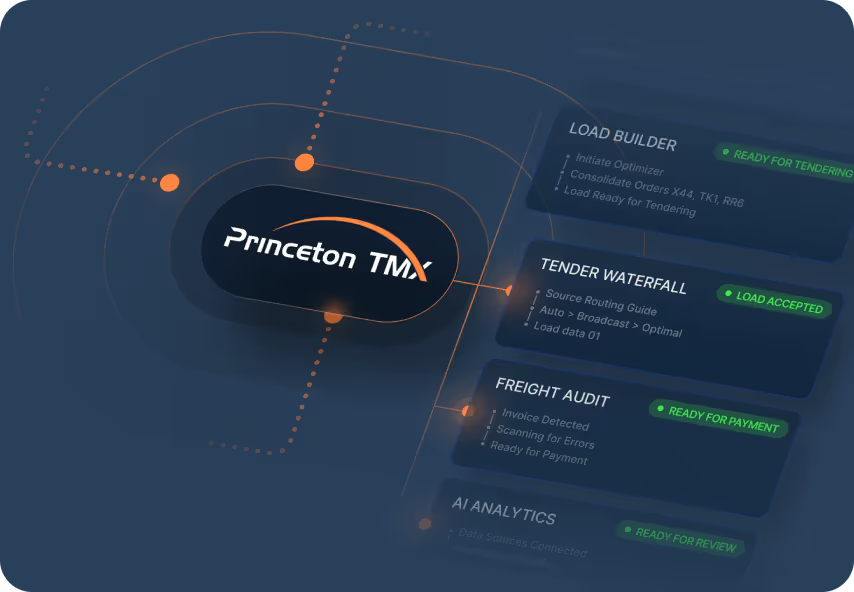
One platform for all your tech


Unify Workflows
All modules, data points, and teams work together to eliminate silos and minimize disruptions.

Real-Time Data
Every shipment update flows instantly across teams, carriers, and partners.

End-to-End Visibility
From planning to analytics, the entire shipment lifecycle stays connected.

Scale Operations
Configurable infrastructure allows you to operate across teams, locations, and modes without adding complexity.
Trusted by leading shippers

"Load tendering, which previously involved manual emails and data entry, now operates with minimal human intervention"

"They're helping make our supply chain more strategic and data-driven. We have folks across our business asking to see the data that our TMS is showing us—it's that valuable across our entire organization."

"Today, we have clear, real-time control over deliveries because of Princeton TMX."
Real shippers. Real results.
Learn how industry leading shippers are reducing costs, improving visibility, and gaining control of their freight with Princeton TMX's Unified Transportation Management System
Discover more solutions from Princeton TMX
Workflow Automation
Eliminate manual workload and errors with AI and automation that streamline every part of your transportation management process.
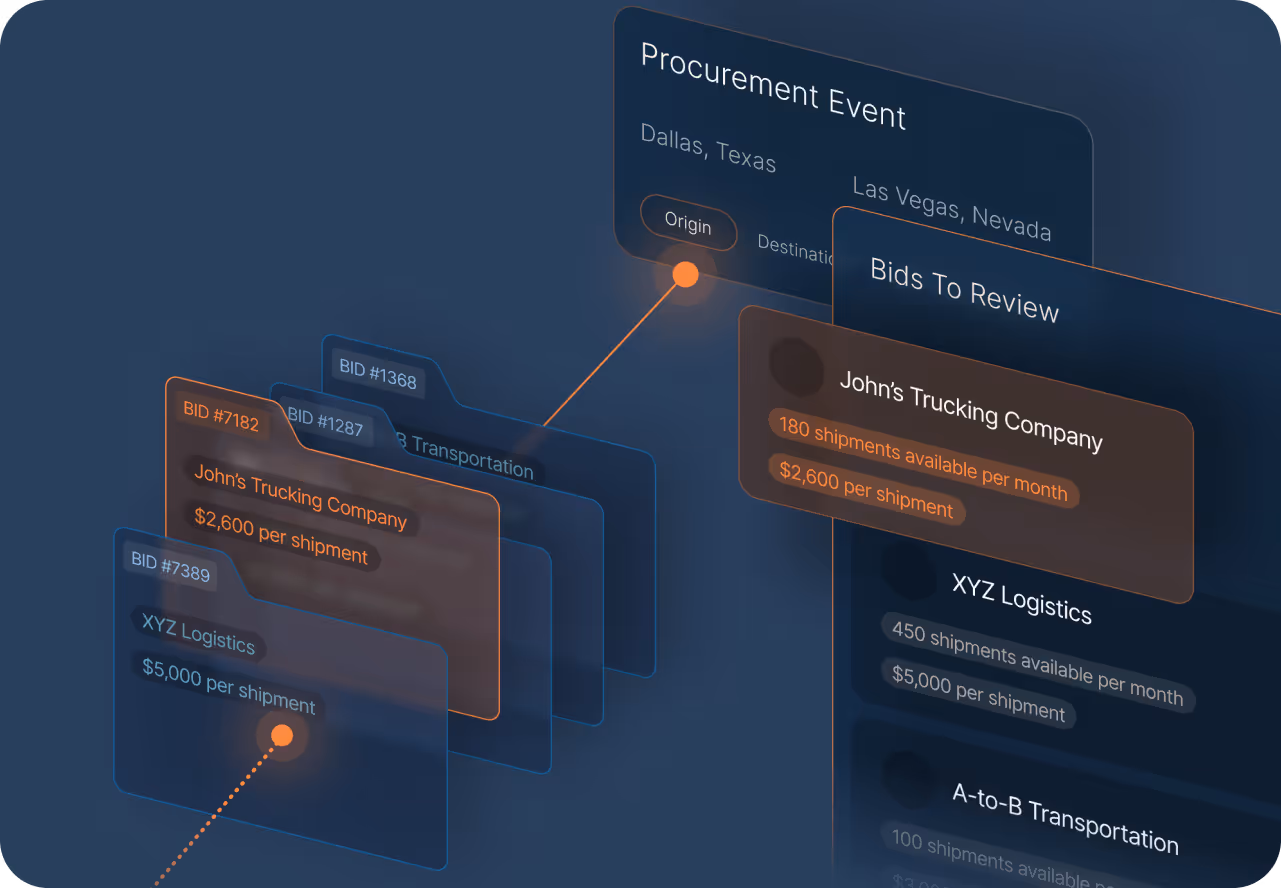
Procurement Events
Secure the best rates and service across every lane by centralizing data, automating communication, and empowering teams with AI-enabled insights.
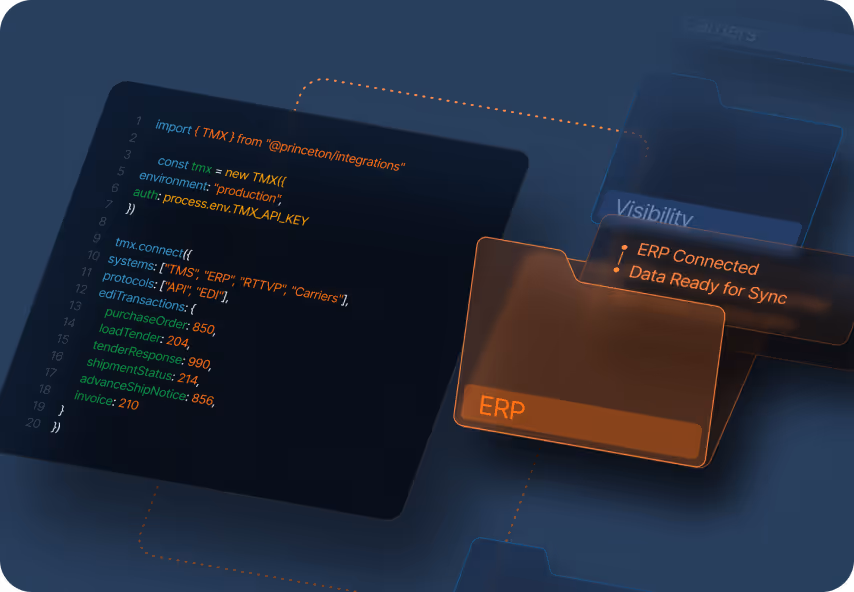
System Integrations
Easily integrate with enterprise resource planning, visibility, procurement, benchmarking, carrier systems, and more, enabling a single source of execution for your transportation teams.
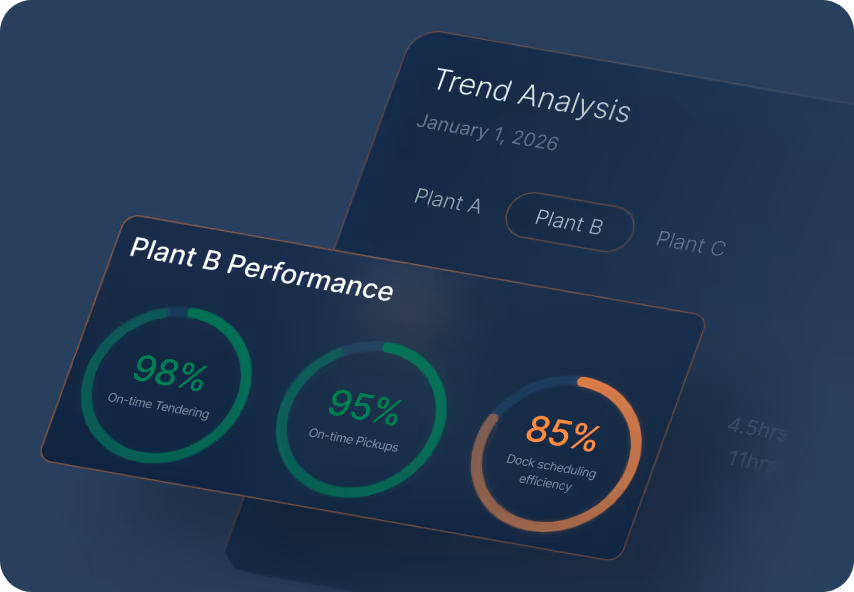
Origin & Plant Performance
Gain clear, data-driven visibility into how each origin, plant, and location operates, helping you optimize origin behavior for both cost and service improvements.
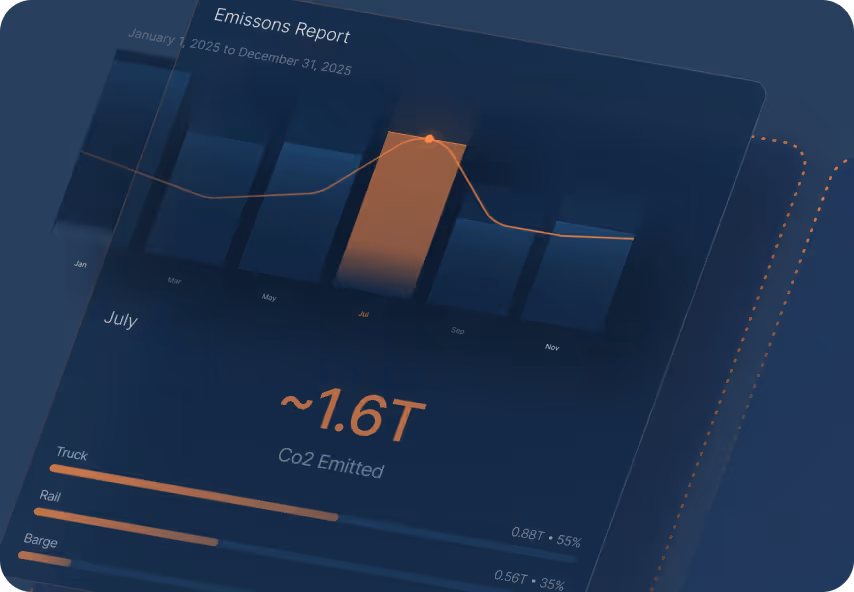
Sustainability Reporting
Meet increasingly complex regulatory and customer expectations by surfacing audit-ready sustainability insights.
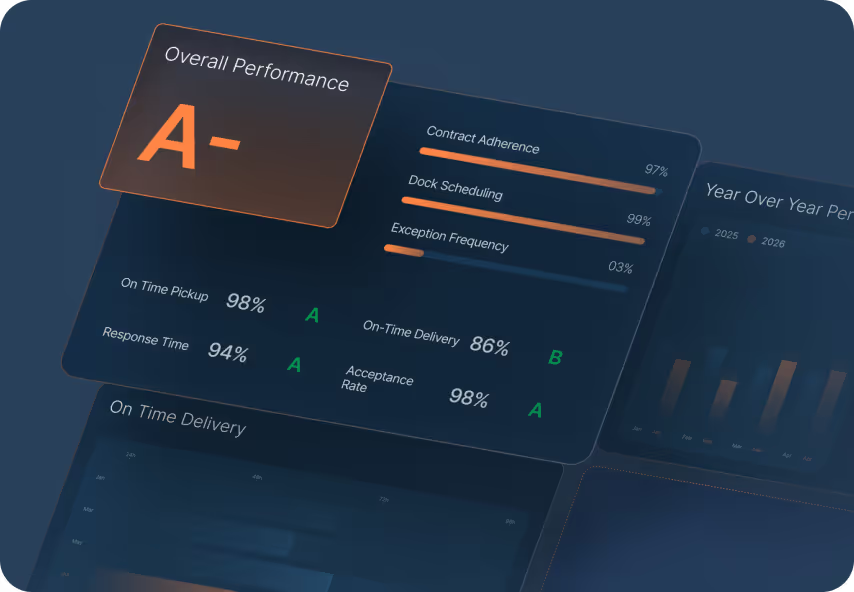
Carrier Performance
Unlock objective, real-time insights into how every carrier performs across cost, service, capacity, and compliance, empowering stronger partnerships and higher reliability.