

Track emissions and lower your footprint
Meet increasingly complex regulatory and customer expectations by surfacing audit-ready sustainability insights
Build a cleaner, more sustainable network with confidence


Get standardized carbon reports across your network
Track emissions with confidence using globally recognized methodologies
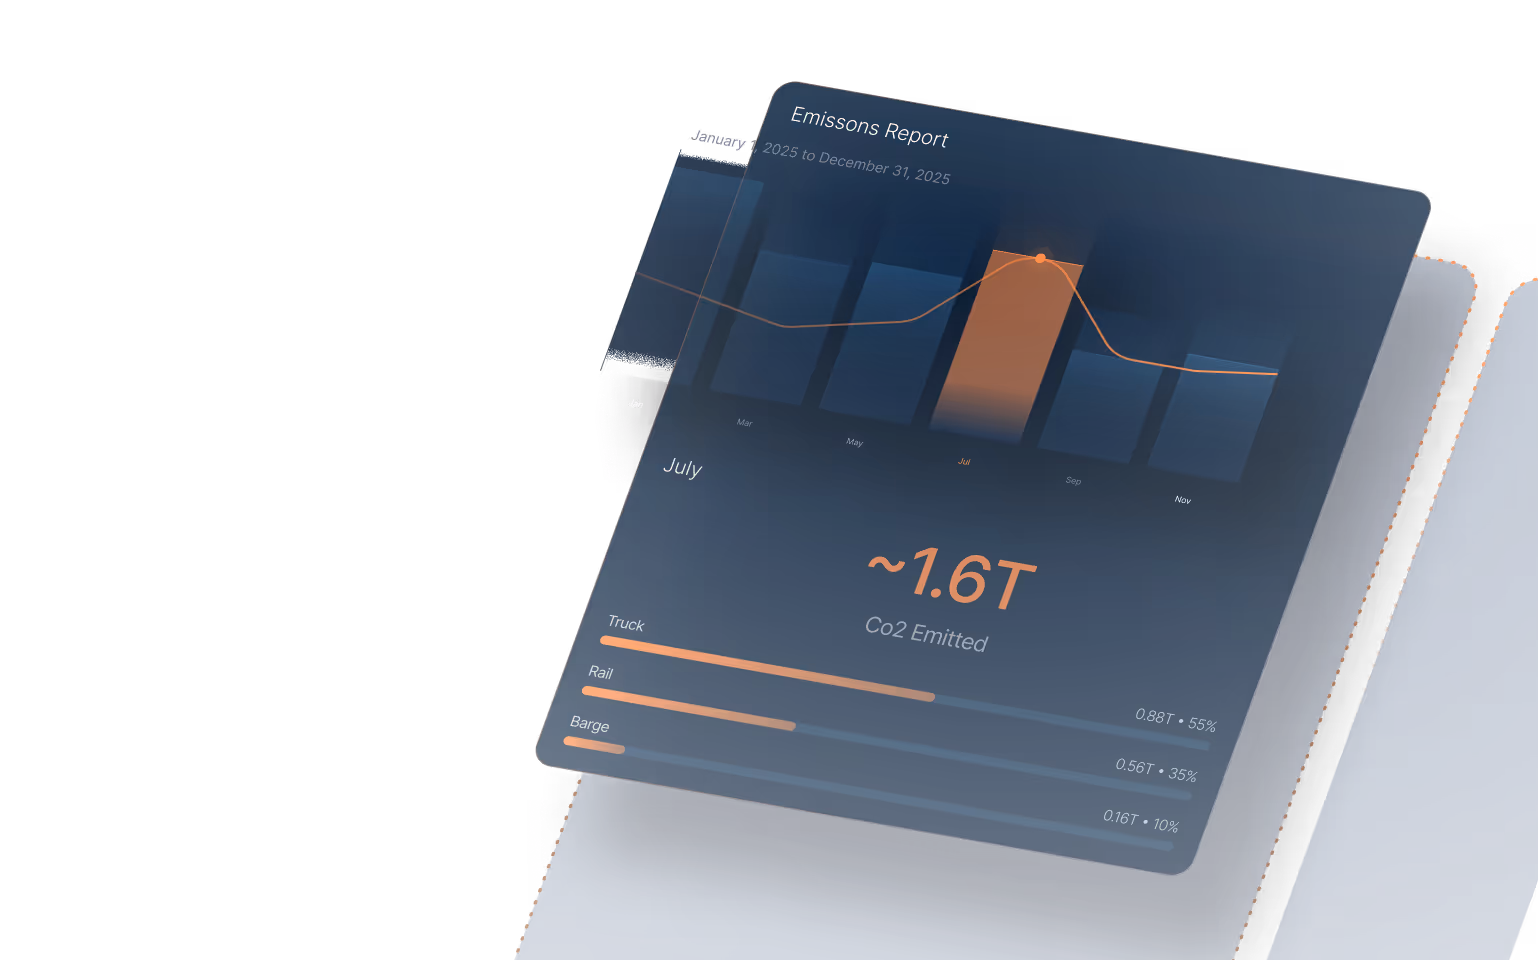
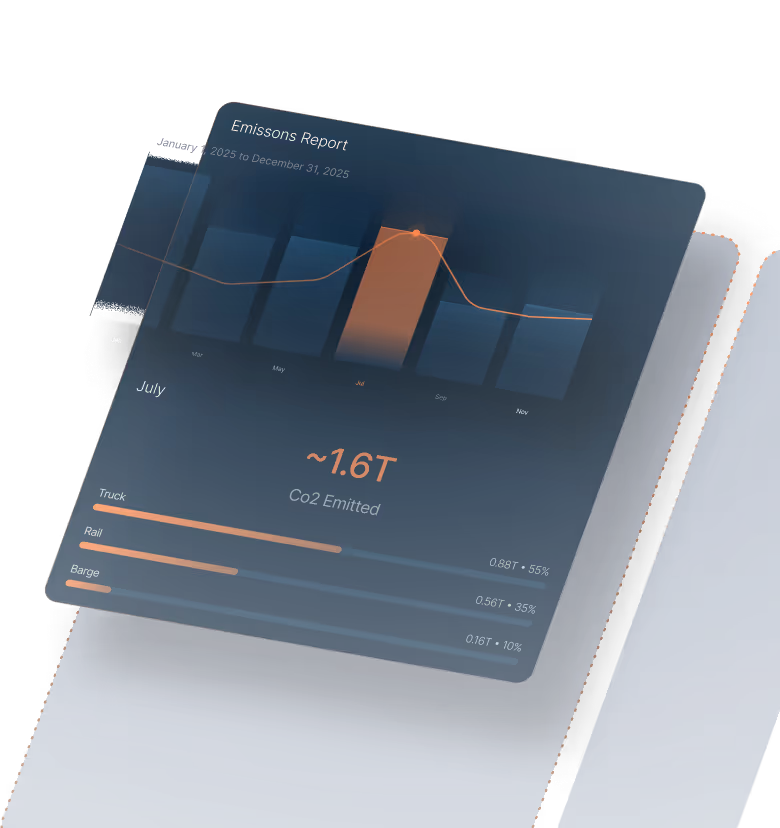
- Calculate CO₂e by shipment, lane, carrier, or mode — gain a granular view of where your carbon footprint is the highest
- Respond to emissions models — ensure compliance with ISO industry standards to maintain audit ready for public agencies

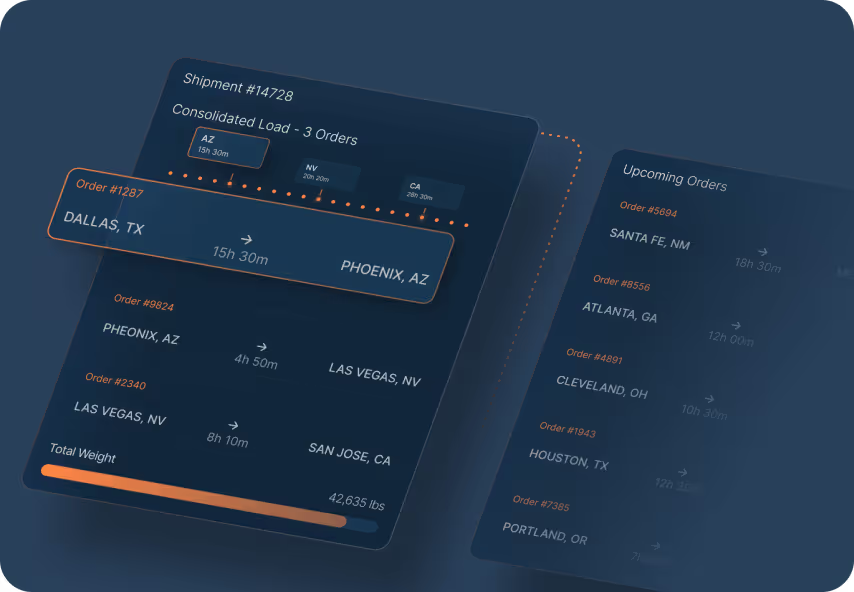
Uncover how lane and mode impact emissions
Reveal the drivers that shape your network’s environmental footprint
- Identify high-emissions lanes — compare performance and uncover where footprint reduction efforts will have the greatest impact
- Quantify emissions trends over time — monitor improvements, regressions, or shifts in your network structure

Meeting emerging compliance requirements with ease
Ensure your transportation sustainability data aligns with regulatory, investor, and customer expectations
- Maintain audit-ready documentation — ensure every emissions calculation, assumption, and data source is traceable and verifiable
- Respond quickly to customer and stakeholder requests — provide standardized sustainability data for RFPs, scorecards, supplier assessments, and ESG audits

One platform for all your tech


Unify Workflows
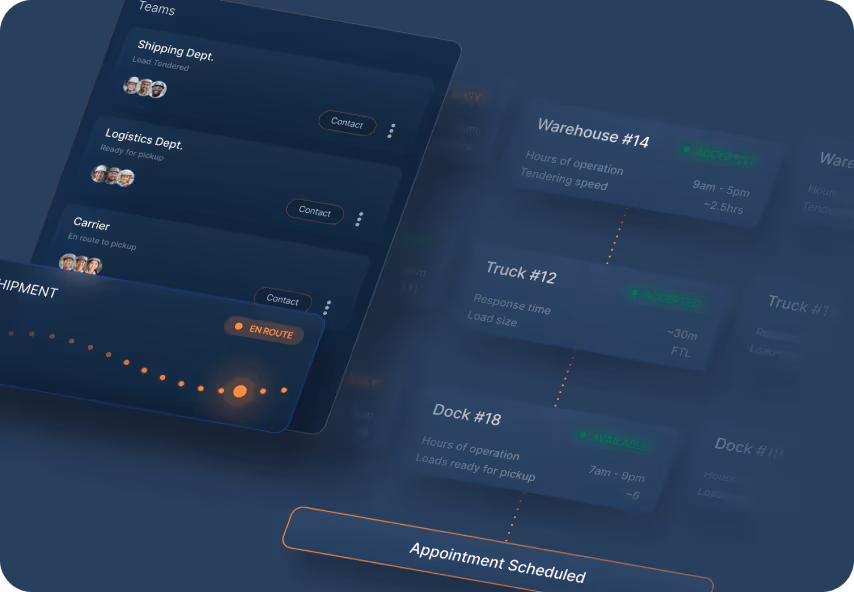
All modules, datapoints, and teams work together to eliminate silos and minimize disruptions.

Real-Time Data
Every shipment update flows instantly across teams, carriers, and partners.

End-to-End Visibility
From planning to analytics, the entire shipment lifecycle stays connected.

Scale Operations
Configurable infrastructure allows you to operate across teams, locations, and modes without adding complexity.
Trusted by leading shippers
"Load tendering, which previously involved manual emails and data entry, now operates with minimal human intervention"

"They're helping make our supply chain more strategic and data-driven. We have folks across our business asking to see the data that our TMS is showing us—it's that valuable across our entire organization."

"Today, we have clear, real-time control over deliveries because of Princeton TMX."
Real shippers. Real results.
Learn how industry leading shippers are reducing costs, improving visibility, and gaining control of their freight with Princeton TMX's Unified Transportation Management System
Discover more solutions from Princeton TMX
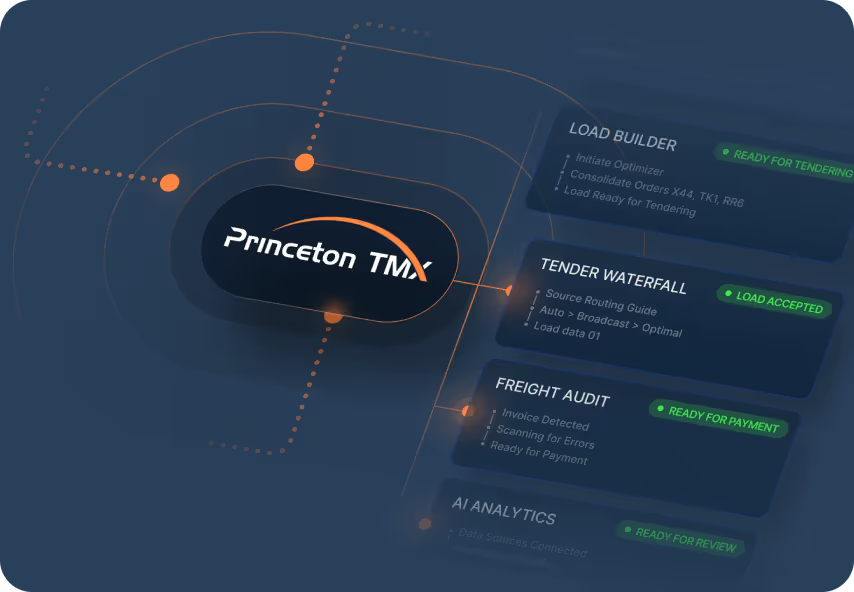
Workflow Automation
Eliminate manual workload and errors with AI and automation that streamline every part of your transportation management process.
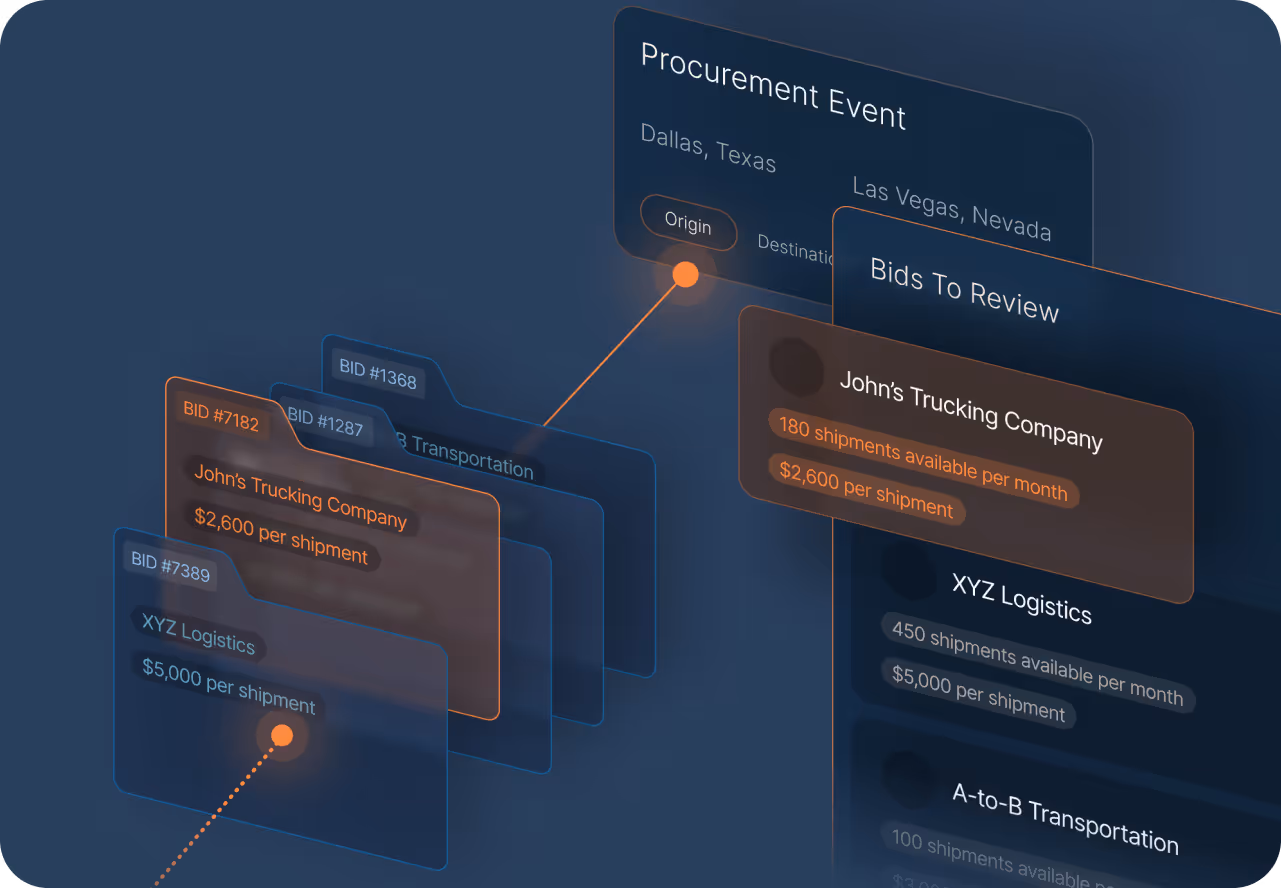
Procurement Events
Secure the best rates and service across every lane by centralizing data, automating communication, and empowering teams with AI-enabled insights.
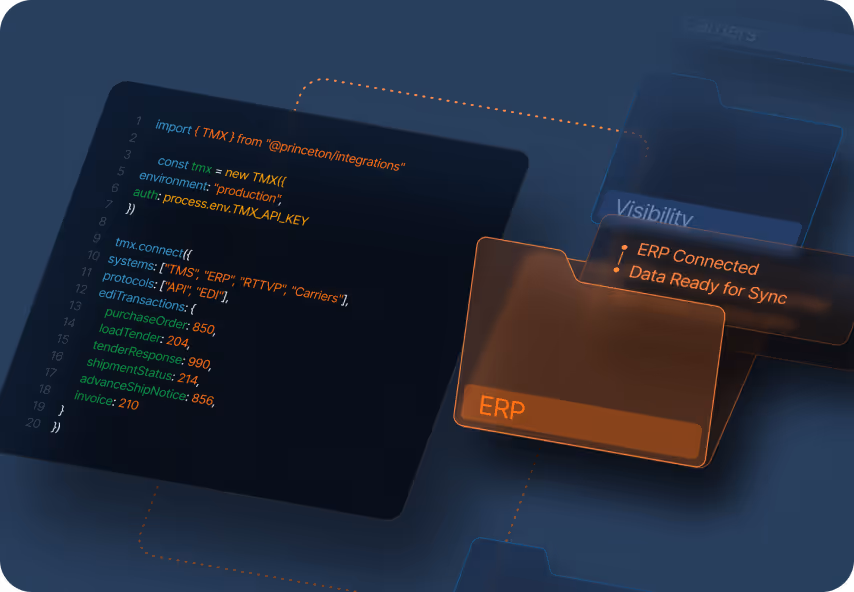
System Integrations
Easily integrate with enterprise resource planning, visibility, procurement, benchmarking, carrier systems, and more, enabling a single source of execution for your transportation teams.
Load Builder Optimization
Maximize utilization, lowering transportation costs, and minimize empty miles by ensuring every load follows your business rules with precision.
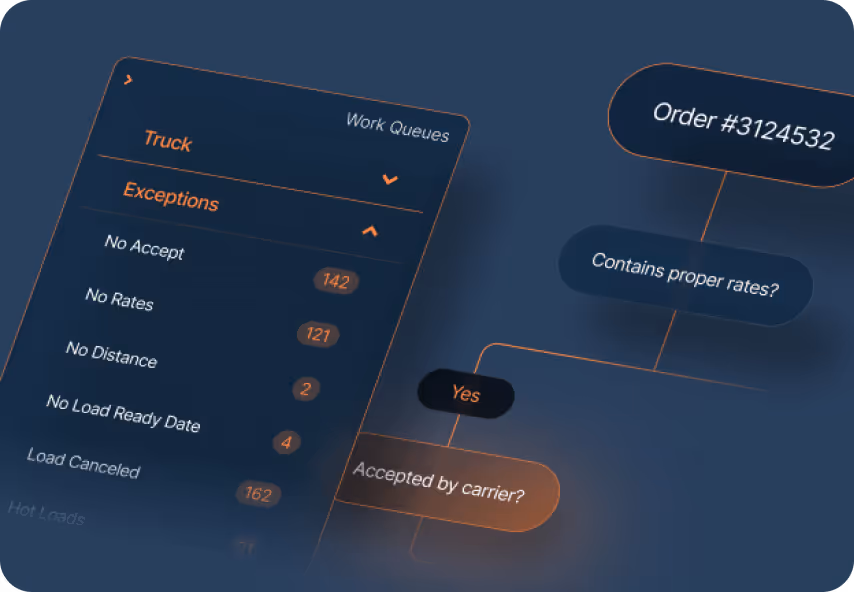
Exception Management
Gain visibility into every disruption, from delays, missed tenders, failed pickups, and more, into one centralized workflow. Empower your team to take action early, reduce service delays, and keep your network running smoothly.
Dock Scheduling
Optimize dock availability, reduce congestion, and keep your facilities running on schedule with unified dock scheduling across all your locations.